GraphElement.setAutoTextColor(Boolean)
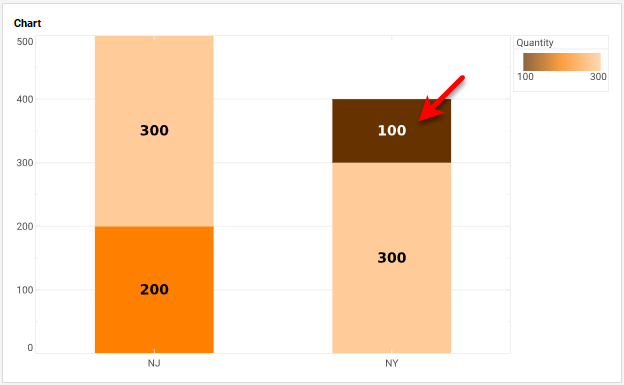
Specifies that the text color for labels on a Bar Chart (text that appears within the colored bars) should be automatically adjusted to enhance readability.
Parameter
- Boolean
-
true: automatically adjust text color
false: do not automatically adjust text color (default)
Example
Chart Component Script
dataset = [["State","Quantity"],["NJ",200], ["NJ",300],["NY",300],["NY",100]]; (1)
graph = new EGraph();
var elem = new IntervalElement("State", "Quantity"); (2)
var scale = new LinearScale("Quantity");
var frame = new HeatColorFrame();
frame.setField("Quantity");
elem.setColorFrame(frame);
var tframe = new DefaultTextFrame('Quantity');
var textspec = new TextSpec();
textspec.setFont(java.awt.Font('Verdana',java.awt.Font.BOLD, 14));
elem.setTextSpec(textspec);
elem.setTextFrame(tframe); (3)
elem.setAutoTextColor(true); (4)
elem.setStackGroup(true);
elem.setCollisionModifier(GraphElement.STACK_SYMMETRIC);
graph.addElement(elem); (5)| 1 | See dataset to use a data block instead of an array literal. |
| 2 | Create the IntervalElement object (Bar Chart). |
| 3 | Use GraphElement.setTextFrame(frame) to display the labels. |
| 4 | Use setAutoTextColor to automatically adjust label color. |
| 5 | Use addElement to add the IntervalElement to the Chart. |
Script that modifies the graph or dataset properties should be placed on the Chart component itself. See Add Component Script for more information. This script has access to the Chart data and Chart API methods. Scripted Charts are not good candidates for user-modification, so you should deselect ‘Enable Ad Hoc Editing’ in the Chart Properties dialog box.
|
|
To change the property on a Chart that was previously created with the Chart Editor, use “getter” methods such as EGraph.getElement(index) ① to obtain a handle to the desired GraphElement object. For example: |