AxisSpec.setInPlot(Boolean)
|
Specifies whether the specified maximum measure value is included within the plot region. When true, this adds a slight buffer to the edge of the plot area in order to ensure that the specified maximum value falls within the displayed plot area. Note: There is no corresponding “getter” function.
Parameter
- Boolean
-
true: display max value within plot region
false: display max value at edge of plot
Example
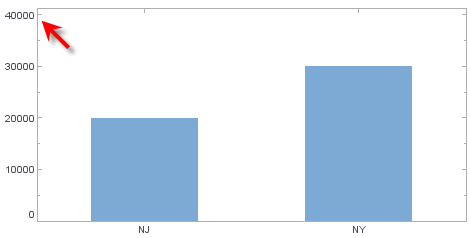
dataset = [["State","Quantity"],["NJ",20000],["NY",30000]]; (1)
graph = new EGraph();
var elem = new IntervalElement("State", "Quantity");
var qscale = new LinearScale("Quantity");
qscale.setMax(40000); (2)
var aspec = new AxisSpec(); (3)
aspec.setInPlot(true); (4)
qscale.setAxisSpec(aspec);
graph.setScale("Quantity", qscale);
graph.addElement(elem);| 1 | See dataset to use a data block instead of an array literal. |
| 2 | Set a fixed maximum for the ‘Quantity’ scale. |
| 3 | Create the AxisSpec object. |
| 4 | Use setInPlot to add a buffer to the plot area. |
Script that modifies the graph or dataset properties should be placed on the Chart component itself. See Add Component Script for more information. This script has access to the Chart data and Chart API methods. Scripted Charts are not good candidates for user-modification, so you should deselect ‘Enable Ad Hoc Editing’ in the Chart Properties dialog box.
|
|
To change the property on a Chart that was previously created with the Chart Editor, use EGraph.getCoordinate() ①, RectCoord.getYScale() ②, and Scale.getAxisSpec() ③ to obtain a handle to the desired Coordinate object, Scale object, and so on. For example: |