ExponentialLineEquation
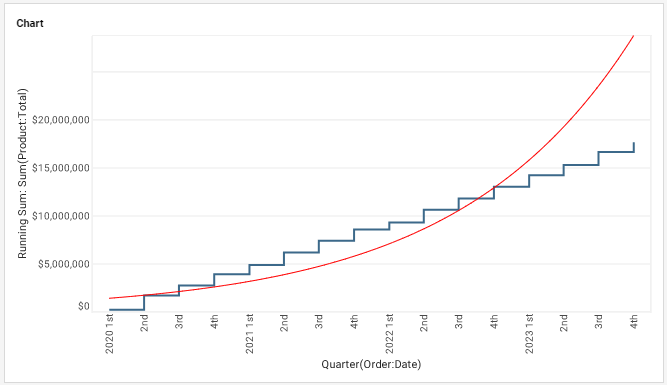
Specifies an exponential data fit for a Chart.
Example
Chart Component Script
var form = new LineForm(); (1)
var equation = new ExponentialLineEquation(); (2)
form.setLineEquation(equation); (3)
form.setColor(java.awt.Color(0xff0000));
graph.addForm(form); (4)| 1 | Create a LineForm object. |
| 2 | Create the ExponentialLineEquation. |
| 3 | Use GraphForm.setLineEquation(line) to apply a the ExponentialLineEquation. |
| 4 | Use EGraph.addForm(form) to add the LineForm to the Chart. |
Script that modifies the graph or dataset properties should be placed on the Chart component itself. See Add Component Script for more information. This script has access to the Chart data and Chart API methods. Scripted Charts are not good candidates for user-modification, so you should deselect ‘Enable Ad Hoc Editing’ in the Chart Properties dialog box.
|