Add Chart Decoration
To draw decorative elements (lines, shapes, text, etc.) on the chart, use a GraphForm object. Consider the following example:
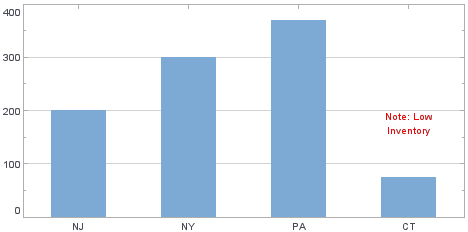
dataset = [["State", "Quantity"],["NJ", 200],["NY", 300], ["PA", 370],["CT", 75]];
graph = new EGraph();
var elem = new IntervalElement("State", "Quantity");
graph.addElement(elem);
Script that modifies the graph or dataset properties should be placed on the Chart component itself. See Add Component Script for more information. This script has access to the Chart data and Chart API methods. Scripted Charts are not good candidates for user-modification, so you should deselect ‘Enable Ad Hoc Editing’ in the Chart Properties dialog box.
|
This generates a basic Bar Chart with quantities for four different states.

To add a small note indicating that the lowest value was due to an inventory problem, follow the steps below.
-
Create a new LineForm object, and specify location values to point at the ‘CT’ bar.
var lineform = new LineForm(); lineform.addValues(['CT', 150]); lineform.addValues(['CT', 100]); -
Set the line color to red, and draw an arrow at the end.
lineform.setColor(java.awt.Color(0xff0000)); lineform.setEndArrow(true); -
Create a new LabelForm object, and specify location values to position it above the ‘CT’ bar.
var labelform = new LabelForm(); labelform.setValues(['CT', 150]); -
Set the label contents, set the text color to red, and center-align. To set the text color, create a new TextSpec object and assign it to the
LabelForm.var labelSpec = new TextSpec(); labelSpec.setColor(java.awt.Color(0xff0000)); labelform.setTextSpec(labelSpec); labelform.setLabel("Note: Low\nInventory"); labelform.setAlignmentX(Chart.CENTER_ALIGNMENT); -
Assign the
LineFormandLabelFormobjects to the Chart’s EGraph object.graph.addForm(lineform); graph.addForm(labelform);