TimeScale.setType(type)
Specifies the placement of tick marks on a TimeScale axis. (This is analogous to the increment setting for a LinearScale axis.) The corresponding “getter” function is getType().
Parameter
- type
-
an axis increment specifier:
TimeScale.DAY
TimeScale.HOUR
TimeScale.MINUTE
TimeScale.MONTH
TimeScale.QUARTER
TimeScale.SECOND
TimeScale.WEEK
TimeScale.YEAR
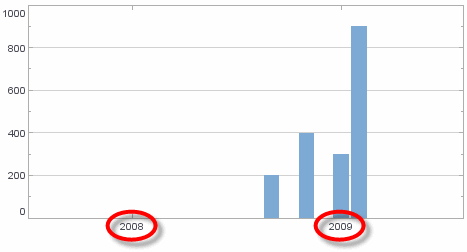
Example
Chart Component Script
dataset = [["Date", "Quantity"], [new Date(2008,8,1),200], [new Date(2008,10,1),400],
[new Date(2009,0,1),300], [new Date(2009,1,1),900]]; (1)
graph = new EGraph();
var elem = new IntervalElement("Date","Quantity");
var tscale = new TimeScale("Date"); (2)
tscale.setType(TimeScale.YEAR); (3)
graph.setScale("Date", tscale); (4)
graph.addElement(elem);| 1 | See dataset to use a data block instead of an array literal. |
| 2 | Create the TimeScale object. |
| 3 | Use setType to set a year increment. |
| 4 | Use EGraph.setScale(field, scale) to assign the Scale to the Chart. |
Script that modifies the graph or dataset properties should be placed on the Chart component itself. See Add Component Script for more information. This script has access to the Chart data and Chart API methods. Scripted Charts are not good candidates for user-modification, so you should deselect ‘Enable Ad Hoc Editing’ in the Chart Properties dialog box.
|
|
To change the property on a Chart that was previously created with the Chart Editor, use EGraph.getCoordinate() ① and RectCoord.getXScale() ② to obtain a handle to the desired Coordinate object and Scale object. For example: |