Export a Dashboard
| These features are available to both designers and end-users. |
Watch Video: Exporting Data from a Dashboard
This video might show an earlier version of the feature or operation that differs in minor ways from the current version.
The following sections explain how to export a Dashboard in its entirety, as well as how to export data from a Dashboard.
Export an Entire Dashboard
Watch Video: Exporting Data from a Dashboard (Export Entire Dashboard)
This video might show an earlier version of the feature or operation that differs in minor ways from the current version.
To export a static copy of the Dashboard into Excel, PowerPoint, PDF, HTML, or PNG format, follow the steps below:
-
Press the ‘Export’ button
 in the Dashboard toolbar. This opens the ‘Export’ dialog box.
 -
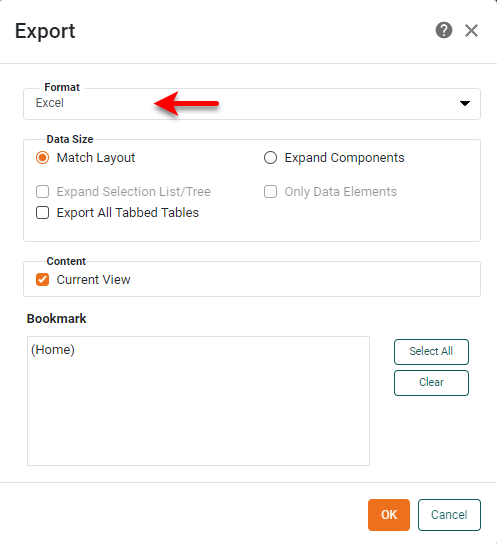
Choose the export type: ‘Excel’, ‘PowerPoint’, ‘PDF’, ‘HTML’, ‘PNG’, ‘CSV’, or ‘Snapshot’.
The ‘Snapshot’ option (if available) is mainly used for troubleshooting purposes. It produces a portable version of the Dashboard that incorporates an embedded (static) copy of the underlying data. This “snapshot” Dashboard can be loaded into another server installation via incremental deployment. (See Import and Export Assets for more details.) -
In the ‘Data Size’ panel, select ‘Match Layout’ to obtain the closest possible match between the appearance of the exported copy and the original Dashboard. Select ‘Expand Components’ to fully expand scrolling tables and scrolling charts to show all data. Select the ‘Only Data Elements’ option to limit the export to only the data-bearing components.
-
Select ‘Current View’ to include the current state of the Dashboard in the exported file.
-
For ‘CSV’ format, select ‘Export All Tables’ to include all Dashboard tables in the export. To include only specific tables, uncheck ‘Export All Tables’ and select the desired tables to export from the ‘Assemblies’ list. In the ‘Delimiter’ field, enter the character to be used to separate entries in the CSV file. (The default delimiter character is a comma.) For tab-delimitation, select the ‘Tab Delimited’ option. Enter a value in the ‘Quote’ field to use this character to quote exported values. Select ‘Keep Header’ to include the column headers in the export. Filename length may be limited by the machine operating system.
-
For ‘Excel’ format, select ‘Export All Tabbed Tables’ to export tables within different tabs of a Tabbed Interface into separate Excel tabs. (See Arrange Components for more information about Tabbed Interfaces.) If you select a bookmark, the bookmark name will be used as the name of the first tab. If you select ‘Current View’, the name of the tab will be “Current View”. In Excel exports only, text that contains HTML markup will be exported as text with markup, not as rendered images. Filename length may be limited by the machine operating system.
Leading zeros may not be visible if you open the exported file in Excel. -
Select the bookmarks that you wish to include in the exported file. The selected views are converted to individual pages (PowerPoint and PDF) or sheets (Excel) in the exported copy.
-
Press OK to close the dialog box and proceed with the export.
Export Crosstab Data
To export the aggregated data displayed in a Crosstab, see Export Table Data data below. To export the detail data on which the aggregations are based, follow the steps below:
-
Select the desired aggregates by clicking the appropriate cells, rows, or columns in the Crosstab. Hold down the Ctrl or Shift key to select multiple cells.
-
Press the ‘Show Details’ button
 at the top-right of the Crosstab.
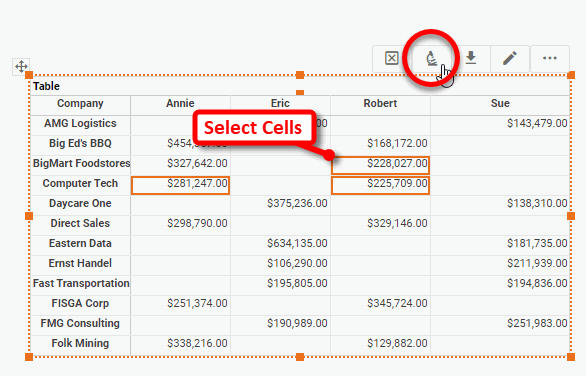
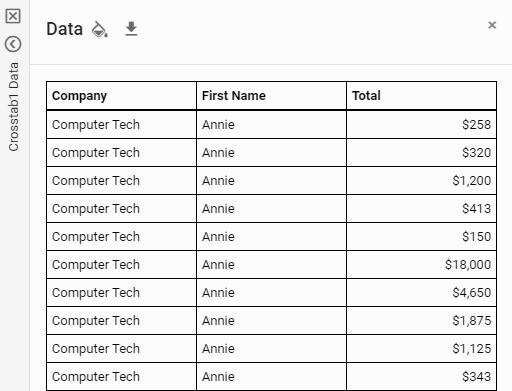
This opens a panel containing the detail data.
-
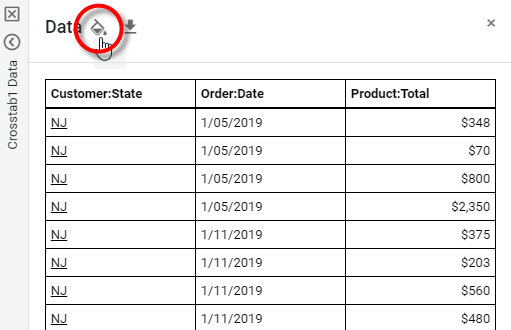
Optional: To format values in the Data panel, press the ‘Format’ button
 in the header of the column you wish to format.
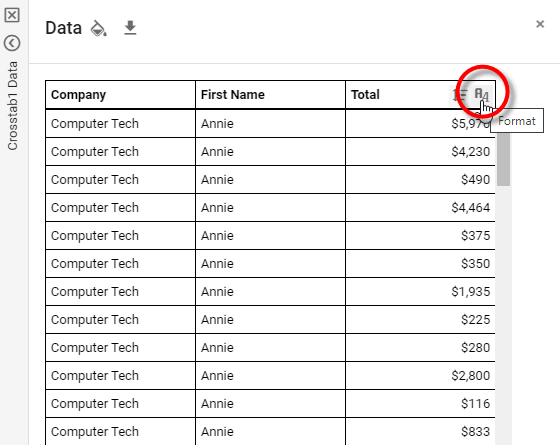
This opens the ‘Format’ dialog box, which allows you to set the format for the column. See Add Data Format for information about the available options.
Formatting that you specify is saved with the Dashboard, and is automatically applied to the column whenever the ‘Show Details’ option is used, both in Visual Composer and the User Portal.
-
To apply a global table style, press the ‘Table Style’ button
 .
.
This opens the ‘Table Style’ dialog box. Select a table style, and press OK.
-
To sort a column press the ‘Sort’ button
 in the column header. To hide a column, right-click the column header, and select ‘Hide Column’.
 -
Press the ‘Export’ button
in the Data panel. Press Close to close the Data panel.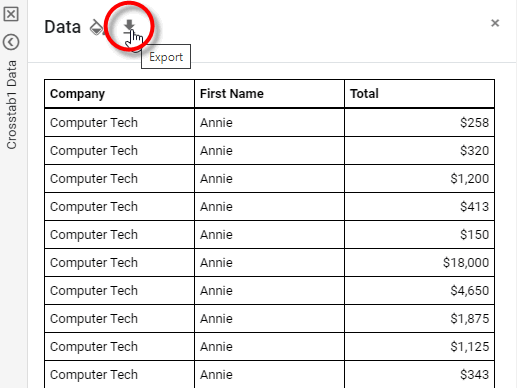
Export Table Data
Watch Video: Exporting Data from a Dashboard (Export Table Data)
This video might show an earlier version of the feature or operation that differs in minor ways from the current version.
To export the data contained in a Table or the aggregate data contained Crosstab, follow the steps below:
| To export the detail data from a Crosstab, see Export Crosstab Data above. |
-
Click the ‘Export’ button
in the Table title bar. This opens the ‘Export’ dialog box.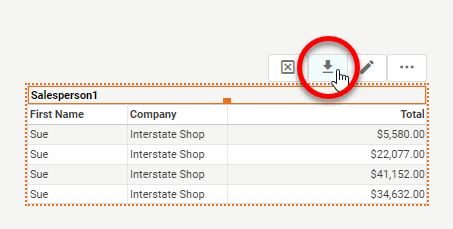
-
In the ‘Export’ dialog box, enter a name for the exported Excel file, and press OK.
This will save the table data as an Excel file in the browser’s default download location.
Export Chart Data
| Drill Down into Data, for information on exporting underlying detail records. |
Watch Video: Exporting Data from a Dashboard (Export Chart Data)
This video might show an earlier version of the feature or operation that differs in minor ways from the current version.
To display a chart’s aggregate data in tabular form, follow the steps below:
-
Press the ‘Show Summary Data’ button
 at the top-right of the chart.
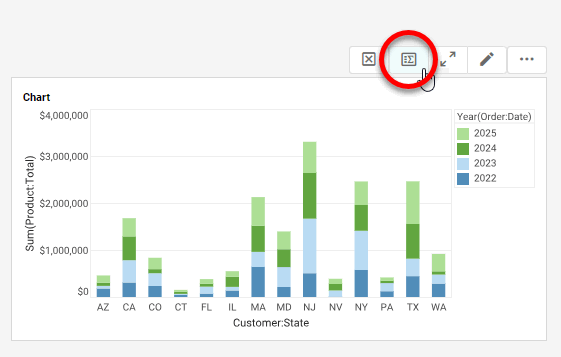
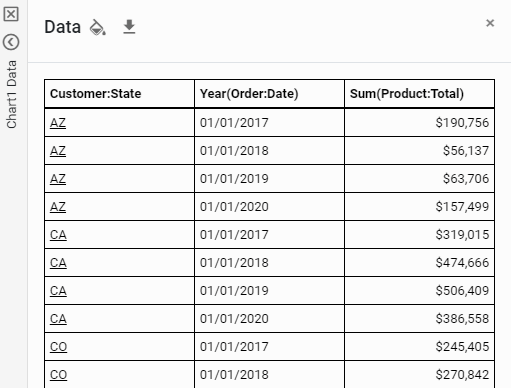
This opens the Data panel.
-
Optional: To format values in the Data panel, press the ‘Format’ button
in the column header that you want to format.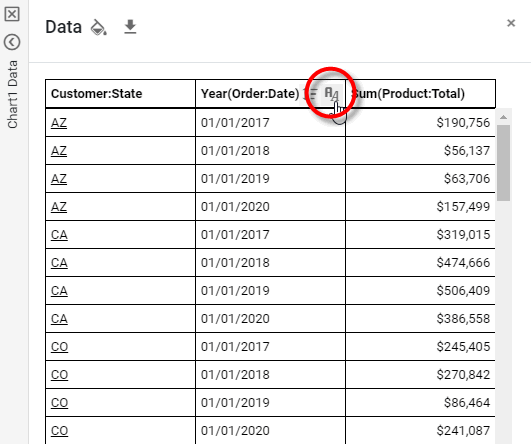
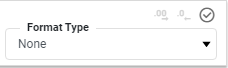
This opens the ‘Format Type’ panel. Select the desired format for the column and press the ‘Apply’ button
 . See Add Data Format for information about the available options.
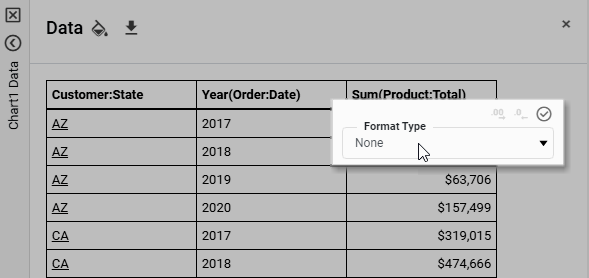
Formatting that you specify is saved with the Dashboard, and is automatically applied to the column whenever the ‘Show Data’ option is used, both in Visual Composer and the User Portal.
-
To apply a global table style, press the ‘Table Style’ button
.This opens the ‘Table Style’ dialog box. Select a table style, and press OK.
-
To sort a column press the ‘Sort’ button
in the column header. To hide a column, right-click the column header, and select ‘Hide Column’. -
Press the ‘Export’ button
in the Data panel.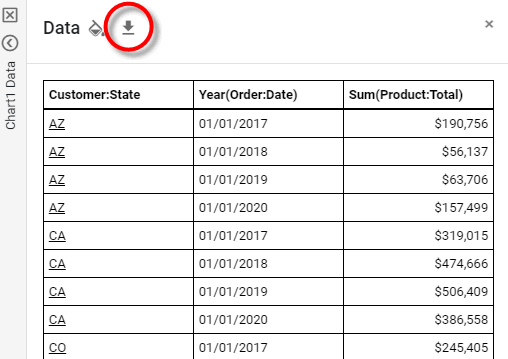
Export a Chart as Image
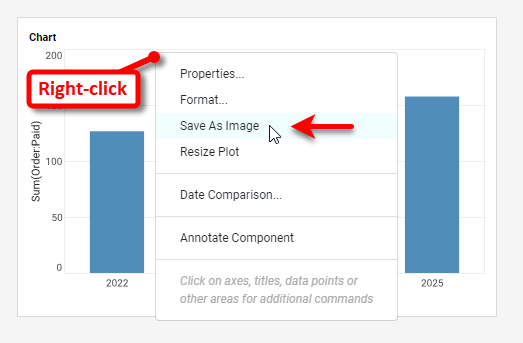
To save an individual Chart as an image, follow the steps below:
-
If you are editing the Dashboard in Visual Composer, press the ‘Preview’ button
 in the toolbar to preview the Dashboard.
 -
Right-click the Chart and select ‘Save As Image’ from the context menu. When prompted, choose either SVG or PNG format.
| To copy a chart label to the clipboard, click on the label. |
Export a Dashboard with Editable Data
Dashboards provide several features to assist in offline data editing. You can export data from Table and Input components into an Excel file, edit the data values and make input selections within the Excel file, and re-import the revised data and selections into the Dashboard at a later time. This allows you to edit a Dashboard offline, while not actively logged into the server.
Dashboard Designer
To configure a Dashboard so that users can export data to an Excel file for editing (and subsequent importing), follow the steps below:
-
For each table that you wish to make editable in Excel, right-click the table, and select ‘Properties’ from the context menu. Note: You can also access menu options from the ‘More’ button (
 ) in the mini-toolbar. This opens the ‘Table Properties’ panel.
 -
Select the General tab, and enter a unique name for the table in the ‘Name’ field. (This name will be used to label the table in the Excel export, and to match the Excel table to the Dashboard table during subsequent importing.)
-
Select the Advanced tab, and check the ‘Enable Table Editing’ option. Select the desired editing features, ‘Add Rows’, ‘Delete Rows’, and/or ‘Edit Rows’. If you want Table edits to persist across sessions, enable ‘Write Back to Storage’. See Table Properties for more information about all these options.
-
Press OK to close the ‘Table Properties’ panel.
Dashboard User
To export a Dashboard for editing (and subsequent importing), follow the steps below:
-
Press the ‘Export’ button
in the Dashboard toolbar.Do not use the ‘Export’ button in the table title bar. -
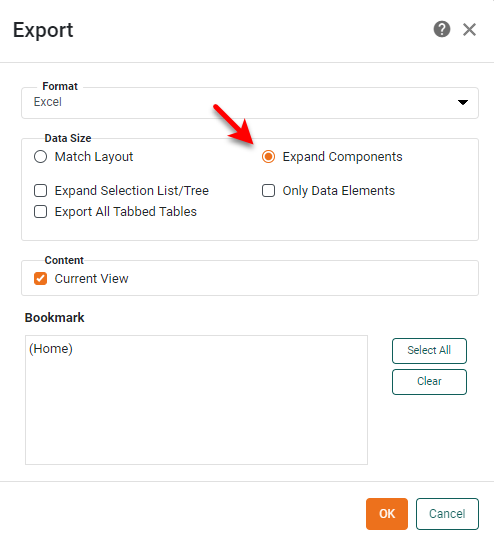
Select the ‘Excel’ export option in the ‘Format’ menu.
-
Select the ‘Expand Components’ option.
-
Under the Location tab, select the ‘Desktop’ option.
-
Press OK to close the dialog box and export the Dashboard.
This saves the Excel file (with the same name as the Dashboard) in the browser’s default download directory. You can now open the file in Excel, and edit the tables or modify input elements as desired. To re-import the modified Excel data back into the Dashboard, see Import a Dashboard with Editable Data below.
Import a Dashboard with Editable Data
|
Dashboards provide several features to assist in offline data editing. You can export data from Table and Input components into an Excel file, edit the data values and make input selections within the Excel file, and re-import the revised data and selections into the Dashboard at a later time. This allows you to edit a Dashboard offline, while not actively logged into the server.
To import data from Excel into a Dashboard, the following conditions must be satisfied:
-
The Excel file must be created by the export procedure described in Export a Dashboard with Editable Data above. (If the Excel file was created by another process, the import will not succeed.)
-
Each editable Table and Input component in the Dashboard must have the same name (set by the ‘Name’ field in the ‘Properties’ dialog box) as the corresponding table or input in the Excel file. These names are used to match the Excel components with the corresponding Dashboard components.
When you have verified the above conditions, follow the steps below to import the modified data from the Excel file:
-
Press the ‘Import Excel’ button
 in the Dashboard toolbar. This opens the file selection dialog box.
 -
Choose the Excel file that you want to import, and press ‘Open’.
This uploads the Excel data into the Dashboard tables with corresponding names, and updates input elements with revised settings. Records that have been added or edited within Excel are highlighted for better visibility.
-
Press the ‘Apply’ button
in each Table toolbar to save the updated information.