ColorFrame
A ColorFrame object contains the color treatment for visual chart elements. You can use a ColorFrame object to represent data dimensions with color (color coding), or to apply a fixed (static) color style. To create a ColorFrame object, call one of the various ColorFrame constructors, for example:
var frame = new CircularColorFrame('Quantity');You can pass the name of a field (e.g., ‘Quantity’) to the constructor, or specify this later using the inherited VisualFrame.setField(field) property. You can also assign a ColorFrame using the bindingInfo.colorFrame property in onRefresh script. See Example 2 below.
Example 1
Chart Component Script
var elem = graph.getElement(0); (1)
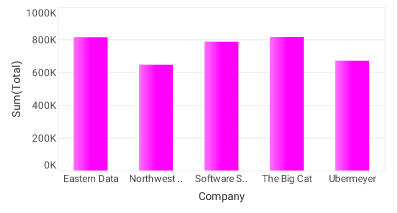
var frame = new StaticColorFrame(); (2)
frame.setColor(java.awt.Color(0xFF00FF));
elem.setColorFrame(frame); (3)| 1 | Use EGraph.getElement(index) to obtain a handle to the desired GraphElement object. |
| 2 | Create the ColorFrame object. |
| 3 | Use GraphElement.setColorFrame(frame) to add the ColorFrame to the Chart. |
Script that modifies the graph or dataset properties should be placed on the Chart component itself. See Add Component Script for more information. This script has access to the Chart data and Chart API methods. Scripted Charts are not good candidates for user-modification, so you should deselect ‘Enable Ad Hoc Editing’ in the Chart Properties dialog box.
|
Example 2
This example illustrates how to use bindingInfo properties to control the ColorFrame.
onRefresh Script
Chart1.bindingInfo.setColorField("Total",Chart.NUMBER);
Chart1.bindingInfo.colorFrame = new BrightnessColorFrame;
Chart1.bindingInfo.colorFrame.color = 0xFF00FF;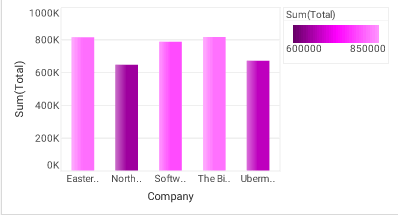
Dashboard script that modifies bindingInfo should generally be placed in the onRefresh handler. See Add Dashboard Script.
|