Add Text or HTML
Watch Video: Creating a Dashboard (Add Text)
This video might show an earlier version of the feature or operation that differs in minor ways from the current version.
You can add text, such as titles or descriptions, to any region of a Dashboard. Text can contain UTF-8 (unicode) characters as well as HTML markup.
| To assemble the text string using script in the Script tab, see the text property. To assemble the text string using Expression script on the ‘Text’ property in the ‘Text Properties’ dialog box, see Control Properties with Expression. |
Add Regular Text
To add regular text into a Dashboard, follow the steps below:
-
If necessary, create a new Dashboard. (See Create a New Dashboard.)
-
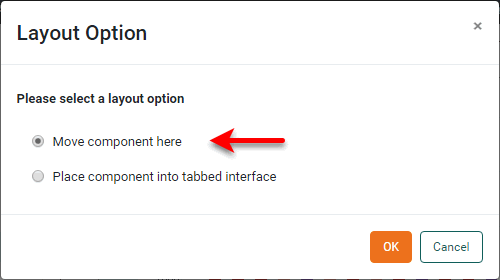
From the Toolbox panel, drag a Text component into the Dashboard. (If you see the following ‘Layout Option’ dialog box, select ‘Move component here’ and press OK.)
-
Double-click on the Text component to edit the text contents. Enter the desired text.
Optional: To enter the value of a parameter into the text, for example a parameter named
param1, use the following syntax:{parameter.param1} // no format, convert to string {parameter.param1, number, '$#,###M'} // number format {parameter.param1, text, '--{0}--'} // text format {parameter.param1, date, 'MM/d/yy'} // date format {parameter.param1, duration, 'ddd HH:mm:ss'} // duration format {parameter.param1, percent} // percent format {parameter.param1, currency} // currency formatThe optional second parameter specifies the format type (e.g.,
number), and the third parameter then specifies the format string, if required (e.g.,'#,###M'). For more information about formats and strings, see Add Data Format. The parameter value can be set by script, by user input, or from session information (e.g.,parameter._USER_). See parameter in Advanced Dashboard Scripting for more information. -
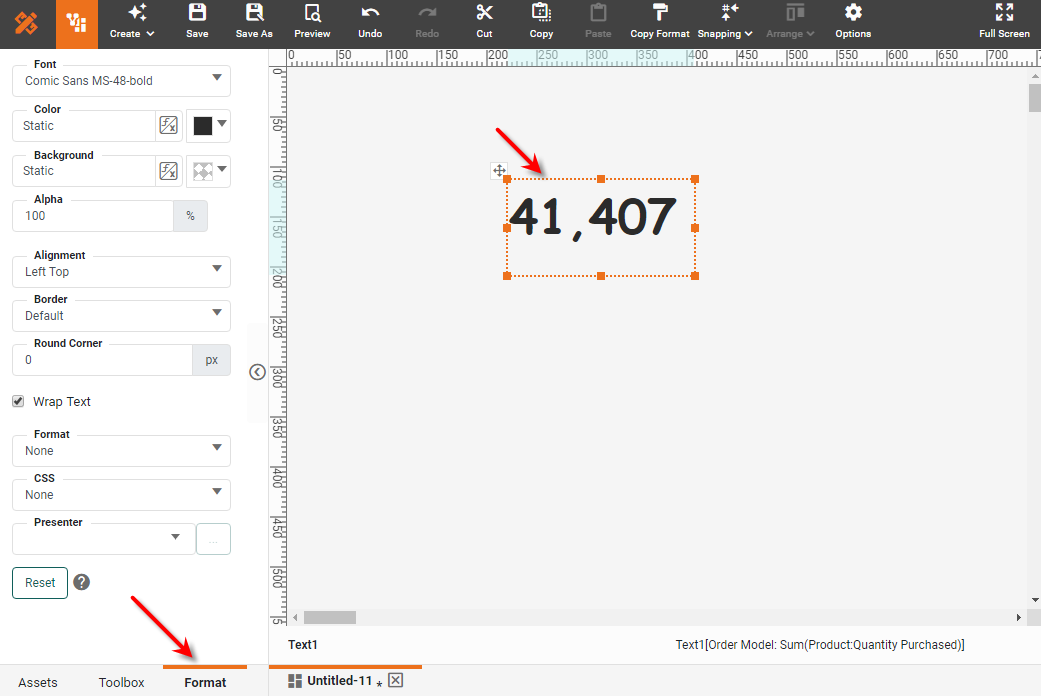
Optional: Click the Text component to select it, and select the Format tab in the left panel. Style the text as desired. (See Add Visual Format for more details.)
Watch Video: Creating a Dashboard (Format Text)
This video might show an earlier version of the feature or operation that differs in minor ways from the current version.
Display HTML
There are two ways to display HTML content within a Dashboard. One method is to use the Basic HTML presenter, which is available for data elements such as Text and Tables. See Add Visual Format for more information.
You can also display HTML content within any element that displays text (e.g., Table cell, Text component, Selection List, etc.) by simply surrounding the HTML markup with <html>…</html> tags. For example, the following markup placed within a Text element creates a list within the Text element:
<html><font color="#0000FF"><b>My List:</b></font><ul><li>Apples</li><li>Oranges</li><li>Mangos</li></ul></html>You can use any HTML tags allowed by the browser. For example, you can display a video or other multimedia in an IFrame, as shown below.
| It may be easier to allow the IFrame to be created automatically. See Embed External Content for more information. |
<html>
<iframe width="560" height="315" src="..." frameborder="0" allowfullscreen>
</iframe>
</html><html>
<!DOCTYPE html>
<body>
<video width="320" height="240" controls>
<source src="https://www.w3schools.com/html/movie.mp4" type="video/mp4">
<source src="https://www.w3schools.com/html/movie.ogg" type="video/ogg">
Your browser does not support the video tag.
</video>
</body>
</html>| To make an asset (such as an image) accessible by URL, an administrator can upload the asset to the web-assets directory as described in Manage Stored Assets. |
Display an Aggregate as Text
To display an aggregated measure as text, see Add a KPI.