EGraph.getLegendPreferredSize()
Returns the chart legend’s height or width in pixels set by EGraph.setLegendPreferredSize(value). The corresponding “setter” function is EGraph.setLegendPreferredSize(value).
Example
Chart Component Script
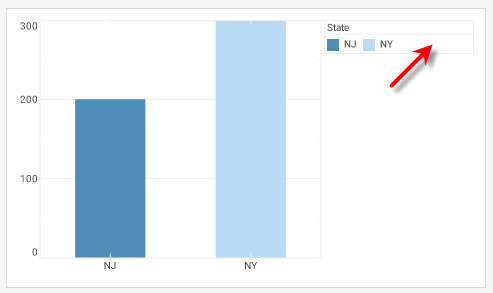
dataset = [["State", "Quantity"], ["NJ",200], ["NY",300]]; (1)
graph = new EGraph();
var elem = new IntervalElement("State", "Quantity");
var frame = new CategoricalColorFrame();
frame.setField("State");
elem.setColorFrame(frame);
graph.setLegendPreferredSize(150); (2)
graph.addElement(elem);
alert(graph.getLegendPreferredSize()); (3)| 1 | See dataset to use a data block instead of an array literal. |
| 2 | Set the legend size. |
| 3 | Use getLegendPreferredSize() to get the legend size. |
Script that modifies the graph or dataset properties should be placed on the Chart component itself. See Add Component Script for more information. This script has access to the Chart data and Chart API methods. Scripted Charts are not good candidates for user-modification, so you should deselect ‘Enable Ad Hoc Editing’ in the Chart Properties dialog box.
|
|
To use the property on a Chart that was previously created with the Chart Editor, simply call the function. For example: |