Use a Dashboard
The following sections explain how to open and use a Dashboard in the Portal. See Use Filter Components to learn how to explore your data using Dashboard filters.
| Mobile devices should be running iOS 7 or later, or Android 4.1 "Jelly Bean" or later, to view Dashboards. |
Open a Pinned Dashboard
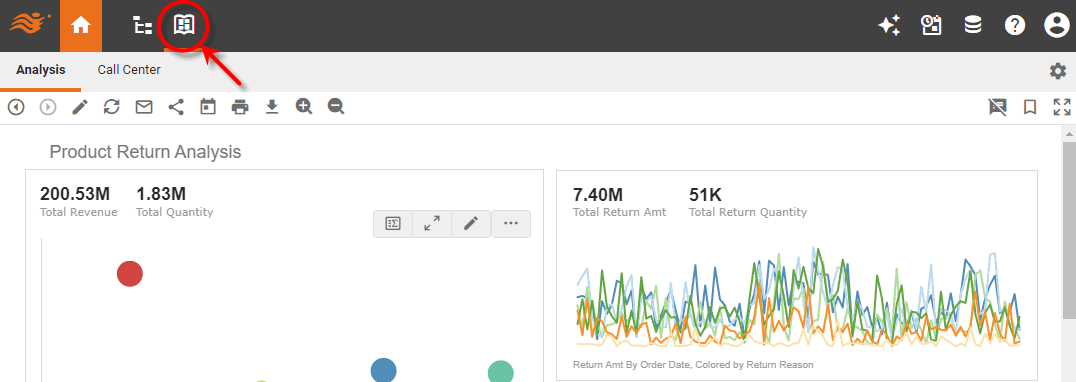
To open a Dashboard using the Portal’s ‘Dashboard’ button  , follow the steps below.
-
Open the User Portal. (See Use the Portal.)
-
Press the ‘Dashboard’ button
at the top of the User Portal. -
Select the tab for the Dashboard that you want to view.
See Use Filter Components to learn how to explore your data using Dashboard filters. See Pin a Dashboard for information on how to add and manage Dashboards under the ‘Dashboard’ button .
Open a Repository Dashboard
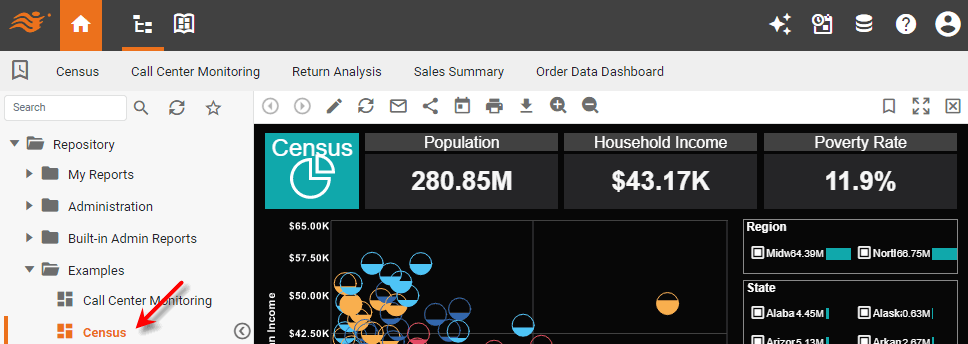
To open a Dashboard using the Portal’s ‘Repository’ button  , follow the steps below.
-
Open the User Portal. (See Use the Portal.)
-
Press the ‘Repository’ button
at the top of the User Portal. -
In the tree on the left side of the Portal, expand the folder containing the desired Dashboard.
-
Click to select the Dashboard that you want to view.
See Use Filter Components to learn how to explore your data using Dashboard filters. See Manage the Repository for information on how to organize Dashboards under the ‘Repository’ button .
Use the Dashboard Tools
The Dashboard toolbar has the following buttons:

| Not all buttons may be available at all times. |
- ‘Previous’ button

-
Undoes the most recent action.
- ‘Next’ button

-
Restores the most recent action that was undone.
- ‘Edit’ button

-
Opens the current Dashboard in Visual Composer. For more information about creating and modifying Dashboards using Visual Composer, see Visualize Your Data.
- ‘Refresh’ button

-
Updates the Dashboard with the most current data, bookmarks, and script results.
- ‘Email’ button

-
Sends an export of the Dashboard to another person. See Email a Dashboard for more information.
- ‘Social Sharing’ button

-
Shares the Dashboard to a social network. See Share to a Social Network for more information.
- ‘Schedule’ button

-
Configures a Dashboard for automatic generation and delivery. See Schedule a Dashboard for more information.
- ‘Print’ button

-
Prints the Dashboard on any available printer.
- ‘Export’ button

-
Exports a copy of the Dashboard to Excel, PowerPoint, or PDF format. See Export a Dashboard for detailed instructions.
- ‘Zoom in/out’ button

-
Increase or decrease the Dashboard magnification. You should use this ‘Zoom in/out’ button
rather than the browser’s built-in zoom. (The browser zoom may not preserve dashboard appearance accurately).To zoom into data on a Chart, see Zoom a Chart. - ‘Bookmarks’ button

-
Opens the ‘Bookmark’ menu, which allows you to save a bookmark or load a previously-saved bookmark. Bookmark a Dashboard for more details.
- ‘Full Screen’ button

-
Expands the Dashboard to use the full screen.
- ‘Show Annotations’ button

-
Toggles annotations on and off. See Annotate a Dashboard for more details.
- ‘Close’ button

-
Closes the Dashboard.