GShape.ImageShape
|
The SVGShape object contains a set of shapes for use with StaticShapeFrame and ShapeForm. For element properties requiring a SVGShape object, the shape can be specified as one of the following constants. See Example 1 (SVG Shape Constant) below.
SVGShape.CHECK
SVGShape.DOWN_ARROW
SVGShape.FACE_BLANK
SVGShape.FACE_HAPPY
SVGShape.FACE_OK
SVGShape.FACE_SAD
SVGShape.FACE_SMILE
SVGShape.FEMALE
SVGShape.LEFT_ARROW
SVGShape.MALE
SVGShape.MINUS
SVGShape.PLUS
SVGShape.RIGHT_ARROW
SVGShape.STAR
SVGShape.SUN
SVGShape.UP_ARROW
SVGShape.WARNING
SVGShape.X
SVGShape.NIL (no shape)
You can also create a custom SVGShape from an SVG image stored in the local file system or on a server. See Example 2 (Local SVG Shape) and Example 3 (Remote SVG Shape) below.
Example 1 (SVG Shape Constant)
Chart Component Script
dataset = [["State","Quantity"], ["NJ",200], ["NY",300]]; (1)
graph = new EGraph();
var elem = new PointElement("State","Quantity");
var shapeFrame = new StaticShapeFrame(SVGShape.FACE_HAPPY); (2)
var sizeFrame = new StaticSizeFrame(10);
elem.setSizeFrame(sizeFrame);
elem.setShapeFrame(shapeFrame); (3)
graph.addElement(elem);| 1 | See dataset to use a data block instead of an array literal. |
| 2 | Pass the SVGShape to the StaticShapeFrame constructor. |
| 3 | Use GraphElement.setShapeFrame(frame) to add the ShapeFrame to the PointElement. |
Script that modifies the graph or dataset properties should be placed on the Chart component itself. See Add Component Script for more information. This script has access to the Chart data and Chart API methods. Scripted Charts are not good candidates for user-modification, so you should deselect ‘Enable Ad Hoc Editing’ in the Chart Properties dialog box.
|
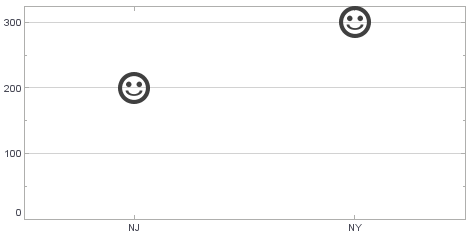
Example 2 (Local SVG Shape)
Chart Component Script
dataset = [["State","Quantity"], ["NJ",200], ["NY",300]]; (1)
graph = new EGraph();
var elem = new PointElement("State","Quantity");
var svg = new SVGShape("file:\C:/HappyFaceSVG.svg"); (2)
var shapeFrame = new StaticShapeFrame(svg); (3)
var sizeFrame = new StaticSizeFrame(10);
elem.setSizeFrame(sizeFrame);
elem.setShapeFrame(shapeFrame); (4)
graph.addElement(elem);| 1 | See dataset to use a data block instead of an array literal. |
| 2 | Pass the image to the SVGShape() constructor to create the svg shape. |
| 3 | Pass the svg shape to the StaticShapeFrame contructor. |
| 4 | Use GraphElement.setShapeFrame(frame) to add the ShapeFrame to the PointElement. |
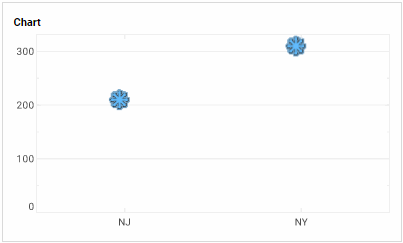
Example 3 (Remote SVG Shape)
Chart Component Script
dataset = [["State","Quantity"], ["NJ",200], ["NY",300]]; (1)
graph = new EGraph();
var elem = new PointElement("State","Quantity");
var svg = new SVGShape("https://www.w3.org/Icons/SVG/svg-logo.svg"); (2)
var shapeFrame = new StaticShapeFrame(svg); (3)
var sizeFrame = new StaticSizeFrame(10);
elem.setSizeFrame(sizeFrame);
elem.setShapeFrame(shapeFrame); (4)
graph.addElement(elem);| 1 | See dataset to use a data block instead of an array literal. |
| 2 | Pass the image URL to the SVGShape() constructor to create the svg shape. |
| 3 | Pass the svg shape to the StaticShapeFrame contructor. |
| 4 | Use GraphElement.setShapeFrame(frame) to add the ShapeFrame to the PointElement. |