CategoricalScale.setFill(Boolean)
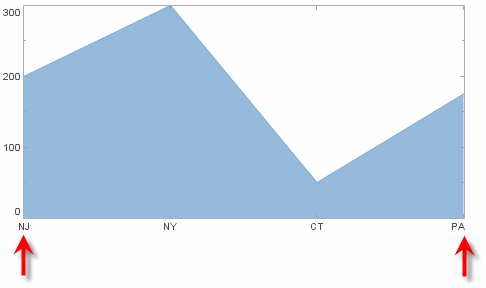
Specifies that scale boundaries should be set equal to the extreme data values (leaving no gap at the axis edges).
Example
Chart Component Script
dataset = [["State", "Quantity"], ["NJ", 200], ["NY", 300], ["CT", 50], ["PA", 175]]; (1)
graph = new EGraph();
var elem = new AreaElement("State", "Quantity");
var sscale = new CategoricalScale("State"); (2)
sscale.setFill(true); (3)
var qscale = new LinearScale("Quantity");
var coord = new RectCoord(sscale, qscale); (4)
graph.setCoordinate(coord);
graph.addElement(elem);| 1 | See dataset to use a data block instead of an array literal. |
| 2 | Create the CategoricalScale object. |
| 3 | Use setFill to fill to edges of axis. |
| 4 | Assign the scale to a Coordinate object. |
Script that modifies the graph or dataset properties should be placed on the Chart component itself. See Add Component Script for more information. This script has access to the Chart data and Chart API methods. Scripted Charts are not good candidates for user-modification, so you should deselect ‘Enable Ad Hoc Editing’ in the Chart Properties dialog box.
|