GraphElement.setLabelPlacement(value)
Specifies the location of element labels. The corresponding “getter” function is getLabelPlacement().
Parameter
- value
-
One of the following constants:
Chart.CENTER  center of element
Chart.BOTTOM  below element
Chart.TOP     above element
Chart.RIGHT   right of element
Chart.LEFT    left of element
Examples
Chart Component Script
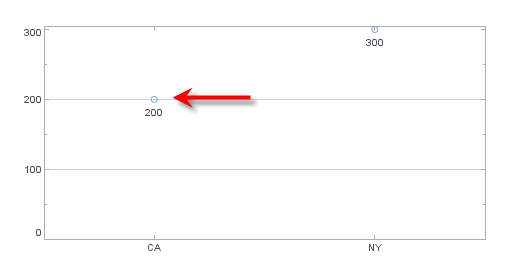
dataset = [["State", "Quantity"], ["CA", 200], ["NY", 300]]; (1)
graph = new EGraph();
var elem = new PointElement("State", "Quantity"); (2)
var frame = new DefaultTextFrame();
frame.setField("Quantity");
elem.setTextFrame(frame);
elem.setLabelPlacement(Chart.BOTTOM); (3)
graph.addElement(elem); (4)| 1 | See dataset to use a data block instead of an array literal. |
| 2 | Create the PointElement object. |
| 3 | Use setLabelPlacement to position the TextFrame labels under the points. |
| 4 | Use addElement to add the PointElement to the Chart. |
Script that modifies the graph or dataset properties should be placed on the Chart component itself. See Add Component Script for more information. This script has access to the Chart data and Chart API methods. Scripted Charts are not good candidates for user-modification, so you should deselect ‘Enable Ad Hoc Editing’ in the Chart Properties dialog box.
|
|
To change the property on a Chart that was previously created with the Chart Editor, use “getter” methods such as EGraph.getElement(index) ① to obtain a handle to the desired GraphElement object. For example: |