StaticColorFrame
The StaticColorFrame object contains a color frame defined by explicit color data in the VisualFrame.setField(field) column, or by the fixed color in StaticColorFrame.setColor(value). To create a StaticColorFrame object, call the StaticColorFrame constructor.
var frame = new StaticColorFrame(); (1)
var frame = new StaticColorFrame(java.awt.Color(0xFF00FF)); (2)| 1 | Call constructor without specifying a color. |
| 2 | Call constructor with specified color. |
You can pass a color value directly to the constructor or specify it later using the in StaticColorFrame.setColor(value) method. StaticColorFrame also provides the special StaticColorFrame.setNegativeColor(value) method.
Example 1
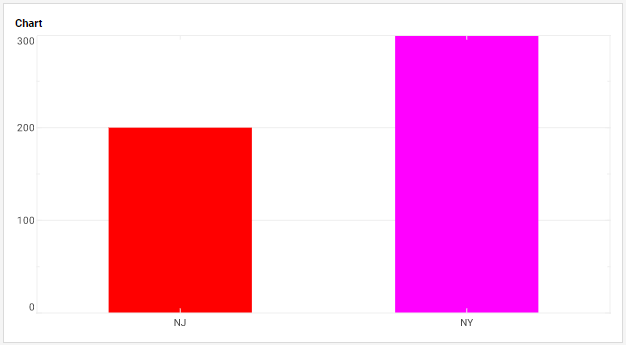
Chart Component Script
dataset = [["State","Quantity","Color"], ["NJ",200,0xff0000], ["NY",300,0xff00ff]]; (1)
graph = new EGraph();
var elem = new IntervalElement("State", "Quantity");
var frame = new StaticColorFrame(); (2)
frame.setField("Color"); (3)
elem.setColorFrame(frame); (4)
graph.addElement(elem);| 1 | See dataset to use a data block instead of an array literal. |
| 2 | Create the StaticColorFrame object. |
| 3 | Use the inherited VisualFrame.setField(field) function to specify the field for the StaticColorFrame. |
| 4 | Use GraphElement.setColorFrame(frame) to add the StaticColorFrame to the IntervalElement. |
Script that modifies the graph or dataset properties should be placed on the Chart component itself. See Add Component Script for more information. This script has access to the Chart data and Chart API methods. Scripted Charts are not good candidates for user-modification, so you should deselect ‘Enable Ad Hoc Editing’ in the Chart Properties dialog box.
|