Facebook Page Insights Query
To create a new data set from an existing Facebook Page Insights connection, follow the steps below:
-
If you have not yet configured the database connection, see Facebook Page Insights. Then proceed with the steps below.
If you see the ‘Create Visualization’ dialog box, press the ‘Close’ button
 to continue with the steps below (recommended).
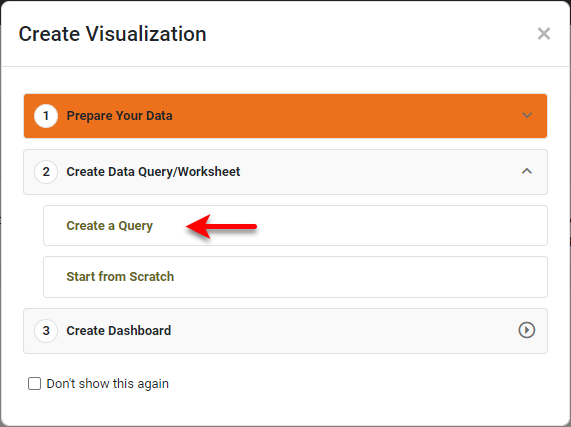
You can also press Create a Query to open the ‘New Data Worksheet’ dialog box, where you can select the query you wish to create. This allows you to skip the ‘Add’ button
 and proceed to the next steps.
 -
Open the Data Worksheet that will contain the data. (See Create a Data Worksheet or Edit a Data Worksheet.)
-
Press the ‘Add’ button
, and select ‘Facebook Page Insights Query’  .
.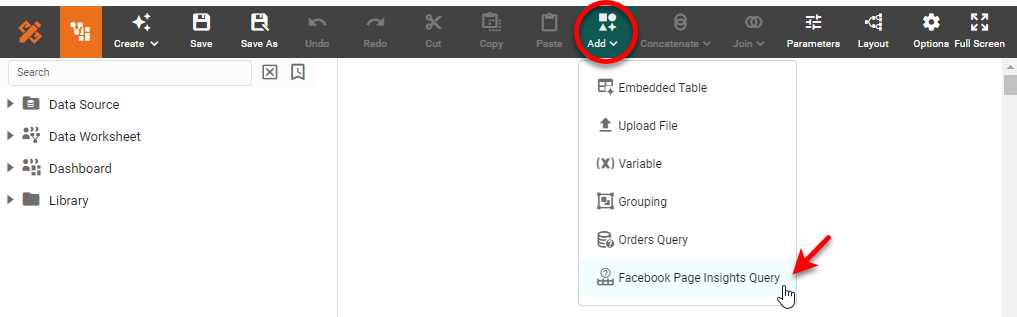
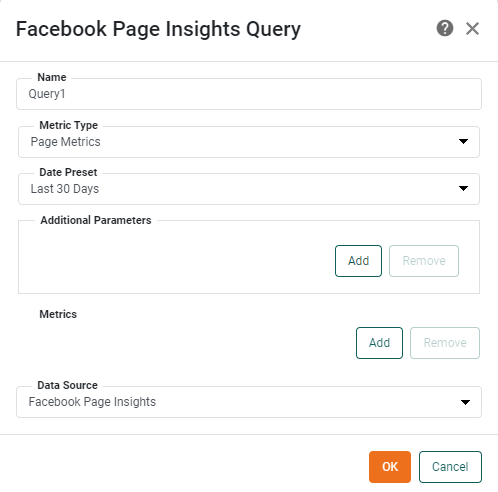
This opens the ‘Facebook Page Insights Query’ dialog box.
-
Select the ‘Metric Type’.
-
In the ‘Date Preset’ menu, select the range of dates for the data that you want to analyze.
-
Optional: To add additional parameters, press the Add button in the ‘Additional Parameters’ region. (See the Facebook developer website for a list of Parameters. Use the ‘Quick Add’ menu to add a listed parameter.)
-
Press the Add button to add a ‘Metric’ field. Enter the metric that you want to retrieve. (See the Facebook developer website for a list of available metrics.)
-
Repeat the above step to add additional metrics. To remove a metric, check the box next to the metric and press Remove. (Use the ‘Quick Add’ menu to add a listed metric.)
-
Press OK. This creates a new data block in the Data Worksheet.
-
Optional: Right-click on the data block, and select ‘Properties’ from the context menu. Note: You can also access menu options from the ‘More’ button (
 ) in the mini-toolbar. This opens the ‘Table Properties’ panel. In the ‘Name’ field, enter a name for the data block, and press ‘OK’. (See Modify a Column for information about how to rename columns.
Names must be unique without respect to case (e.g., "num1" is the same name as "Num1"). -
Press the ‘Save’ button
 in the toolbar to save the Data Worksheet.
You can now do pipeline operations on this data, as described in Prepare Your Data, or you can proceed to create Dashboards based on this Data Worksheet. See Visualize Your Data for information about how to construct a Dashboard.