valueFormats
|
Provides access to value formatting for Charts that have ‘Multiple Styles’ enabled. (See Multiple Style Chart for information about the ‘Multiple Styles’ property in Dashboards.) To format a measure in a multiple-style chart, set the valueFormats property for the desired measure.
Type
See the following properties for the appropriate value type: valueColor, valueFont, valueFormat, valueRotation.
Example
Chart1.valueFormats['Sum(Quantity Purchased)'].color = [255,0,0];
Chart1.valueFormats['Sum(Quantity Purchased)'].rotation = 30;
Chart1.valueFormats['Sum(Total)'].color = [0,0,255];
Chart1.valueFormats['Sum(Total)'].format = [Chart.DECIMAL_FORMAT,"$#,###.00"]
Chart1.valueFormats['Sum(Total)'].font = 'Lucida Sans Unicode-BOLD-8';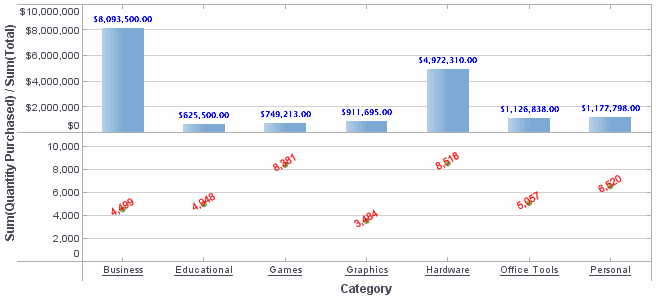
|
Either syntax below can be used in component script: For onInit/onRefresh scripts, and for component and property scripts on other components, the second (qualified) form is required. |