EGraph.getScale(field)
|
Change Chart Scaling for information on setting scales. |
Returns a handle to the Scale object specified by the field parameter. This is useful in cases where the scale was not explicitly assigned to a variable at creation time. The corresponding “setter” function is EGraph.getScale(field).
Example
Follow the steps below:
-
Create a Dashboard based on the ‘Sales Explore’ Data Worksheet. (See Create a New Dashboard.)
The 'Sales Explore' Data Worksheet can be found in . You may need to download the examples.zip file from GitHub into your environment. (This requires access to Enterprise Manager.) See Import and Export Assets for instructions on how to import. -
Add a Bar Chart with ‘Company’ (top 5) on the X-axis, and Sum(Total) on the Y-axis.
-
Add the following script:
Chart Component Scriptvar scale = graph.getScale("Sum(Total)"); (1) scale.setMin(600000); scale.setMax(1000000); (2)1 Obtain handle to Scaleobject.2 Apply operations to Scaleobject.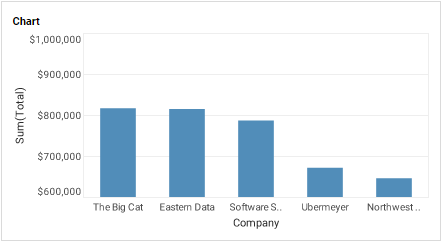
Script that modifies the graph or dataset properties should be placed on the Chart component itself. See Add Component Script for more information. This script has access to the Chart data and Chart API methods. Scripted Charts are not good candidates for user-modification, so you should deselect ‘Enable Ad Hoc Editing’ in the Chart Properties dialog box.
|