fillTimeGap
When you designate a dimension as a “time series” (see bindingInfo.setTimeSeries(col, Boolean)), the fillTimeGap property specifies how missing data is represented on the Chart. When fillTimeGap is false, the plotted lines simply ignore the missing data and connect adjacent points on the chart. When fillTimeGap is true, the behavior for missing data is determined by the fillZero property. See the examples below.
Examples
The following examples display a time-series which is missing data for the month of April 2019. To create this time-series, bind a chart to the ‘Sales Explore’ Data Worksheet.
| The 'Sales Explore' Data Worksheet can be found in . You may need to download the examples.zip file from GitHub into your environment. (This requires access to Enterprise Manager.) See Import and Export Assets for instructions on how to import. |
Place the ‘Date’ field on the X-axis (with ‘Level’ = ‘Month’) and place ‘Total’ on the Y-axis. To simulate missing data, add a condition to the Chart to filter out data from April 2019. (See Add Conditions.) Use the scripts below to modify the way the Chart represents the missing data for April 2019.
Chart1.fillTimeGap = false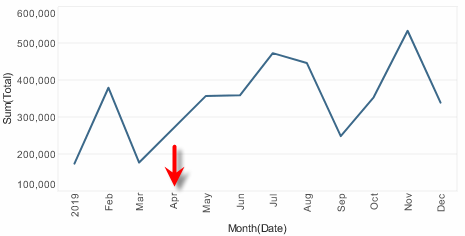
Chart1.fillTimeGap = true; (1)
Chart1.fillZero = false; (2)
Chart1.fillGapWithDash=false; (3)| 1 | Leave gap for missing data. |
| 2 | Do not fill gap with 0. |
| 3 | Set to true to display dashed line in gap. See fillGapWithDash. |
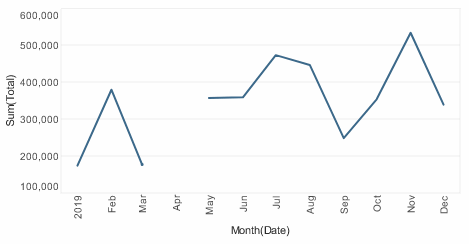
Chart1.fillTimeGap = true;
Chart1.fillZero = true;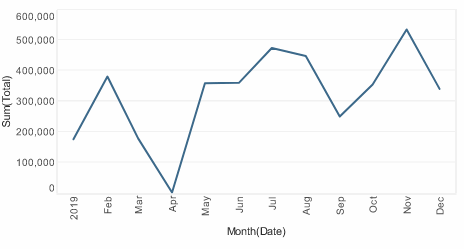
|
Either syntax below can be used in component script: For onInit/onRefresh scripts, and for component and property scripts on other components, the second (qualified) form is required. |