VisualFrame.setScaleOption(value)
Specifies a scaling option for the default scaling. The Scale.TICKS and Scale.ZERO options determine the maximum and minimum values that are used to calculate the scale range.
To combine multiple options, use the pipe (“or”) operator:
frame.setScaleOption(Scale.ZERO | Scale.TICKS);The corresponding “getter” function is getScaleOption().
Parameter
- value
-
-
Scale.TICKS: Use the maximum and minimum tick values (i.e., rounded numbers) rather than the maximum and minimum data values. -
Scale.ZERO: Use zero as the minimum rather than the minimum data value (if positive).
-
Example
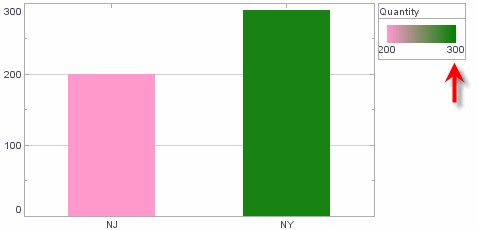
dataset = [["State", "Quantity"], ["NJ",200], ["NY",290]]; (1)
graph = new EGraph();
var elem = new IntervalElement("State", "Quantity");
var frame = new GradientColorFrame(); (2)
frame.setField("Quantity");
frame.setScaleOption(Scale.TICKS); (3)
elem.setColorFrame(frame); (4)
graph.addElement(elem);| 1 | See dataset to use a data block instead of an array literal. |
| 2 | Create the VisualFrame object. |
| 3 | Use setScaleOption to calculate scale with max and min tick values. |
| 4 | Use GraphElement.setColorFrame(frame) to add the VisualFrame to the IntervalElement.
|
Script that modifies the graph or dataset properties should be placed on the Chart component itself. See Add Component Script for more information. This script has access to the Chart data and Chart API methods. Scripted Charts are not good candidates for user-modification, so you should deselect ‘Enable Ad Hoc Editing’ in the Chart Properties dialog box.
|
|
To change the property on a Chart that was previously created with the Chart Editor, use “getter” methods such as EGraph.getElement(index) ① and GraphElement.getColorFrame() ② to obtain a handle to the desired GraphElement and ColorFrame objects. For example: |