GraphForm.setInPlot(Boolean)
|
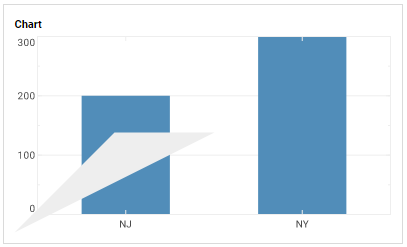
For forms that use relative positioning (values or tuples), specifies whether the chart should be resized so that forms remain fully visible in the chart area. Note: There is no corresponding “getter” function.
Example
Chart Component Script
dataset = [["State", "Quantity"], ["NJ", 200], ["NY", 300]]; (1)
graph = new EGraph();
var form = new LineForm(); (2)
var elem = new IntervalElement("State", "Quantity");
form.addValues(['NJ',0]);
form.addValues(['NJ',300]);
form.addValues(['NY',400]);
form.setInPlot(true); (3)
form.setFill(true);
graph.addForm(form); (4)
graph.addElement(elem);| 1 | See dataset to use a data block instead of an array literal. |
| 2 | Create the GraphForm object. |
| 3 | Use setInPlot() to resize the Chart to fit the GraphForm. |
| 4 | Use EGraph.addForm(form) to add the GraphForm to the Chart. |
Script that modifies the graph or dataset properties should be placed on the Chart component itself. See Add Component Script for more information. This script has access to the Chart data and Chart API methods. Scripted Charts are not good candidates for user-modification, so you should deselect ‘Enable Ad Hoc Editing’ in the Chart Properties dialog box.
|