AxisSpec.setTextFrame(frame)
Specifies a mapping between axis values and replacement text. The corresponding “getter” function is getTextFrame().
Parameter
- frame
-
A TextFrame object
Example
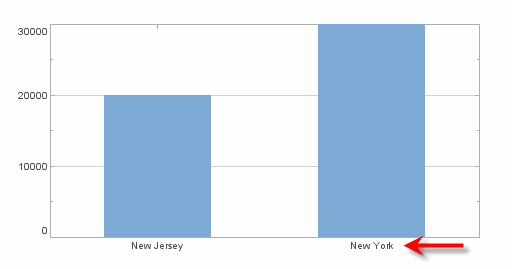
Chart Component Script
dataset = [["State","Quantity"],["NJ",20000],["NY",30000]]; (1)
graph = new EGraph();
var elem = new IntervalElement("State", "Quantity");
var cscale = new CategoricalScale("State");
var tframe = new DefaultTextFrame(); (2)
tframe.setText('NJ','New Jersey');
tframe.setText('NY','New York');
var aspec = new AxisSpec(); (3)
aspec.setTextFrame(tframe); (4)
cscale.setAxisSpec(aspec);
graph.setScale("State", cscale);
graph.addElement(elem);| 1 | See dataset to use a data block instead of an array literal. |
| 2 | Create the TextFrame object. |
| 3 | Create the AxisSpec object. |
| 4 | Use setTextFrame to assign the TextFrame to the axis. |
Script that modifies the graph or dataset properties should be placed on the Chart component itself. See Add Component Script for more information. This script has access to the Chart data and Chart API methods. Scripted Charts are not good candidates for user-modification, so you should deselect ‘Enable Ad Hoc Editing’ in the Chart Properties dialog box.
|
|
To change the property on a Chart that was previously created with the Chart Editor, use EGraph.getCoordinate() ①, RectCoord.getXScale() ②, and Scale.getAxisSpec() ③ to obtain a handle to the desired Coordinate object, Scale object, and so on. For example: |