Special Freehand Table Functions
|
The functions in this section are commonly used to populate cells in a Freehand Table.
inArray()
The inArray() function determines whether a value is part of an array.
inArray(array, value);

//Example:
inArray([1,2,3], $num);
This function is useful as a condition check together with CALC.iif(condition, value_if_true, value_if_false).
toArray()
The toArray() function converts a tableLens object or a delimited string to a JavaScript array.
toArray(tableLens);
toArray(delimString);

//Example:
var a = toArray(Table1.tableLens);
var a = toArray('1,2,3');
You can use the returned JavaScript array to access table data in the usual manner. For example, a[1][2] is the data in 2nd row, 3rd column.
rowList()
The rowList() function generates a list of values from a result set with column grouping, conditional filtering, and other sorting options.
rowList(query, 'condition  spec', 'options   string');

//Example:
rowList(q, 'quantity ? discount > 0','sort=asc');
Here, condition spec is the column name with grouping or conditional specifications, and the options string values are as follows (multiple options are delimited by a comma):
- sort=asc/desc/false
-
Sort the values in ascending or descending order. Default is
false. - distinct=true/false
-
Retrieve only distinct values. Default is
false. - maxrows=num
-
Limit the number of elements returned.
- sortcolumn=column_name
-
Sort data according to a specific query column which is not returned in the list.
The variable ‘q’ contains the results of a query. This is usually generated in onInit Handler script (see Add Dashboard Script) by runQuery(name [,parameters]). For example:
var q = runQuery('ws:global:Examples/AllSales')The rowList() function also adds the fields of the result set to the formula scope of the table cells, so that they can be accessed as field['colName']. Therefore, you can use rowList() to extract a portion of a query result set, and then fill out the table with other fields of the result set which correspond to the records of the extracted rows.
Consider a Freehand Table based on the ‘Sales Explore’ Data Worksheet. Extract all the values in the ‘Date’ field where the sales are greater than $10,000, and then fill the adjacent cell with the category associated with the order. Follow the steps below:
| The 'Sales Explore' Data Worksheet can be found in . You may need to download the examples.zip file from GitHub into your environment. (This requires access to Enterprise Manager.) See Import and Export Assets for instructions on how to import. |
-
Press the ‘Create’ button
 in the Visual Composer toolbar and select ‘New Dashboard’ button
  . This opens the ‘New Dashboard’ dialog box.
 -
Press OK to close the dialog box and create the new Dashboard. (Do not select any data source in the ‘New Dashboard’ dialog box.)
-
Press the ‘Options’ button
 in the toolbar, and select the Script tab. Select the ‘onInit’ option at the bottom and enter the following script:
var q = runQuery('ws:global:Examples/Sales Explore')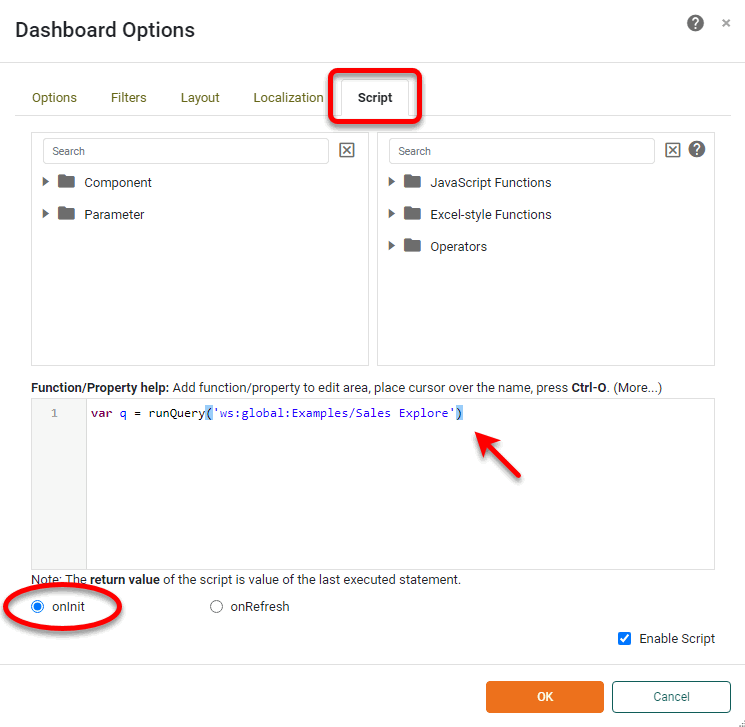
This executes the ‘Sales Explore’ Data Worksheet in the onInit script. (See Run a Query from Script for more details.)
-
Press OK to close the ‘Dashboard Options’ panel.
-
Drag the ‘Freehand Table’ component from the Toolbox panel into the Dashboard. Press the to open the Table Editor.
-
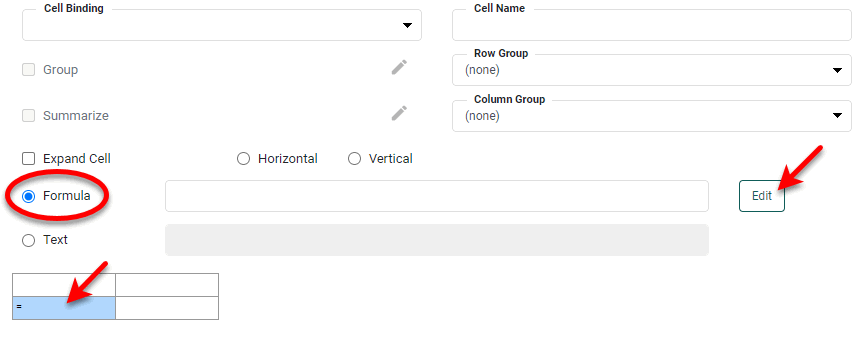
Click on cell[1,0] in the table (second row, first column) to select it.
-
Select the ‘Formula’ option and press the Edit button.
-
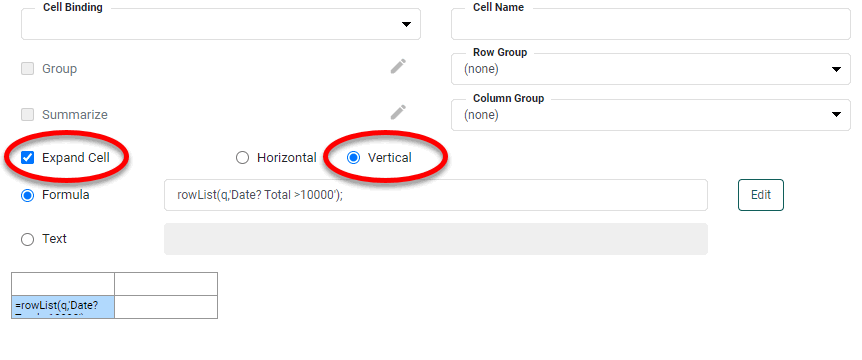
Enter the following formula in the Formula Editor:
rowList(q,'Date? Total > 10000');This extracts values from the ‘Date’ column of the ‘Sales Explore’ Data Worksheet where the corresponding ‘Total’ value is greater than $10000. It also makes the other fields of the data block available via the field syntax, e.g.,
field['Category']. -
Press OK to close the Formula Editor.
-
Select ‘Expand Cell’ and choose ‘Vertical’. (This causes the extracted data to fill down vertically.)
-
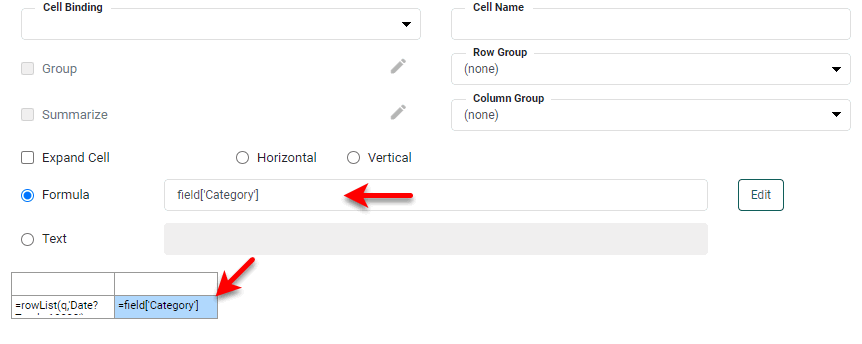
Select cell[1,1] in the table (second row, second column). Select the ‘Formula’ option, and enter the following formula:
field['Category']This returns the value in the ‘Category’ column corresponding to the date in the first column.
-
Press the ‘Finish’ button
 to close the Editor. The resulting table displays the date for all orders greater than $10,000, and the corresponding category.
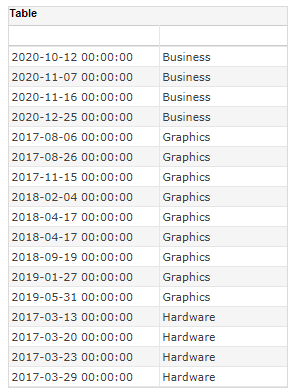
mapList()
The mapList() function groups a list of values according to a specified mapping (named grouping). The mapping array consists of hybrid alternating name-value pairs or [name array]-value pairs.
mapList(list, mapping_array, 'options string')

// Example:
mapList(q['State'],[['AZ','CA'],'West',['NY','NJ'],'East'])
The options string values are as follows (multiple options are separated by a comma delimiter):
- others=groupOthers/leaveOthers
-
Group all unmapped values in a generic group called ‘Others’ (groupOthers), or display each unmapped value as its own group (leaveOthers). Default is ‘groupOthers’.
- sort=asc/desc/false
-
Sort the values in ascending or descending order. Default is
false. - remainder
-
Specifies the label for the ‘Others’ group. If not specified, the ‘Others’ group is not displayed.
- distinct=true/false
-
Retrieve only distinct values. Default is
false.
toList()
The toList() function is the most commonly used Freehand Table function. It generates a unique, sorted, and grouped list from the values in a JavaScript array. In most cases, you will use toList() to obtain distinct values from a query when you create header rows/columns. For example, toList(q['state']) obtains a distinct list of states in ascending order from query variable q.
The full syntax of the function is
toList(list, 'options string')where options string values are as follows (multiple options are separated by a comma delimiter):
- sort = asc/desc/false
-
Sort the values in ascending or descending order. Default is
asc. - sorton
-
Sort the values according to a specified measure. Sorting by
sortonis applied before Top/Bottom-N filtering implemented bymaxrows. For example, where query variableqcontains the full table:toList(q,'field=Company,sorton=sum(Total)');When using the sortonoption, the first argument oftoListshould be the full table/query. - sorton2
-
Sort the values according to a specified measure. Sorting by
sorton2is applied after Top/Bottom-N filtering implemented bymaxrows. For example, where query variableqcontains the full table:toList(q,'field=Company,sorton2=sum(Total)');When using the sorton2option, the first argument oftoListshould be the full table/query. - remainder
-
Specifies the label for the ‘Others’ group when Top/Bottom-N filtering is in effect. If not specified, the ‘Others’ group is not displayed.
- maxrows = num
-
Limits the number of rows returned.
- distinct = true/false
-
Retrieve only distinct values. Default is
true. - date = year / quarter / month / week / day / hour / minute / second / weekday / monthname / weekdayname
-
Group date values according to specified period, and return the period designation.
- rounddate = year / quarter / month / week / day / hour / minute / second / weekday / monthname / weekdayname
-
Group date values according to specified period, and return the rounded date value.
- timeseries = true / false
-
Specifies that gaps in Date data should be retained. For example, if the data is grouped by month, and there is no data for the month of June,
timeseries = trueensures that the month of June is still retained. Default isfalse.
The rounddate option is useful when you want to group by month and year, (e.g., Jan 2005 and Jan 2006, etc.). For example, if the ‘Order Date’ field in a query has the following values,
[Jan-2-2002, Feb-21-2004, Feb-25-2004, Nov-25-2005]the toList function with a rounddate grouping of month,
toList(q['Order Date'], 'rounddate=month');returns a unique list of dates containing the first day of the month of the given year:
[Jan-1-2002, Feb-1-2004, Nov-1-2005]