ShapeForm.setAlignmentX(value)
Specifies the horizontal alignment of the shape with respect to the specified X position. The corresponding “getter” function is getAlignmentX().
Parameter
- value
-
One of the following alignments:
Chart.LEFT_ALIGNMENT
Chart.CENTER_ALIGNMENT
Chart.RIGHT_ALIGNMENT
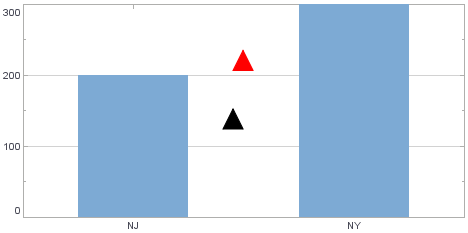
Example
Chart Component Script
dataset = [["State","Quantity"], ["NJ",200], ["NY",300]]; (1)
graph = new EGraph();
var elem = new IntervalElement("State", "Quantity");
var shape1 = new ShapeForm(); (2)
var shape2 = new ShapeForm(); (2)
shape1.setPoint(new java.awt.geom.Point2D.Double(.5,.75));
shape1.setShape(GShape.FILLED_TRIANGLE);
shape1.setColor(java.awt.Color(0xff0000));
shape1.setSize(new java.awt.Dimension(20,20));
shape1.setAlignmentX(Chart.LEFT_ALIGNMENT); (3)
shape2.setPoint(new java.awt.geom.Point2D.Double(.5,.5));
shape2.setShape(GShape.FILLED_TRIANGLE);
shape2.setColor(java.awt.Color(0x000000));
shape2.setSize(new java.awt.Dimension(20,20));
shape2.setAlignmentX(Chart.CENTER_ALIGNMENT); (3)
graph.addForm(shape1); (4)
graph.addForm(shape2); (4)
graph.addElement(elem);| 1 | See dataset to use a data block instead of an array literal. |
| 2 | Create the ShapeForm object. |
| 3 | Use setAlignmentX() to set the horizontal alignment. |
| 4 | Use EGraph.addForm(form) to add the GraphForm to the Chart. |
Script that modifies the graph or dataset properties should be placed on the Chart component itself. See Add Component Script for more information. This script has access to the Chart data and Chart API methods. Scripted Charts are not good candidates for user-modification, so you should deselect ‘Enable Ad Hoc Editing’ in the Chart Properties dialog box.
|
|
To change the property on a Chart that was previously created with the Chart Editor, you do not need to add a Chart element. For example: |