Text/Excel Directory Query
To create a new data set from an existing Text/Excel Directory connection, follow the steps below:
-
If you have not yet configured the database connection, see Text/Excel Directory. Then proceed with the steps below.
If you see the ‘Create Visualization’ dialog box, press the ‘Close’ button
 to continue with the steps below (recommended).
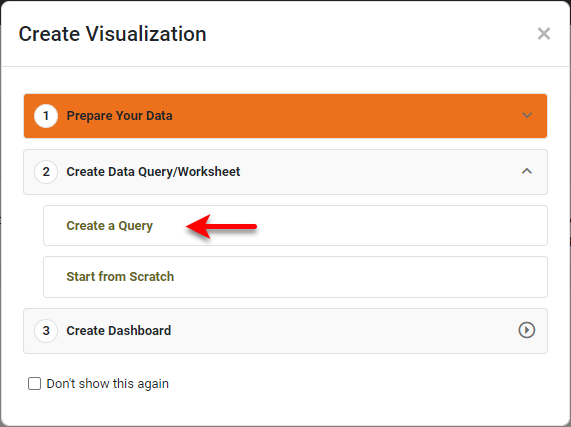
You can also press Create a Query to open the ‘New Data Worksheet’ dialog box, where you can select the query you wish to create. This allows you to skip the ‘Add’ button
 and proceed to the next steps.
 -
Open the Data Worksheet that will contain the data. (See Create a Data Worksheet or Edit a Data Worksheet.)
-
Press the ‘Add’ button
, and select ‘Text/Excel Directory Query’  .
.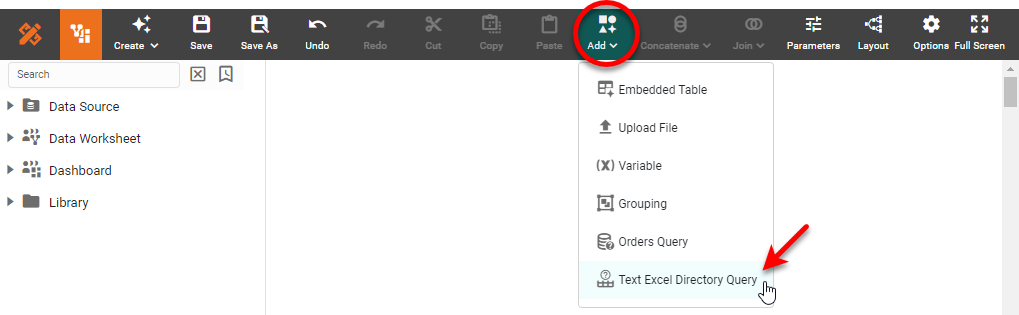
This opens the ‘Text/Excel Directory Query’ dialog box.
-
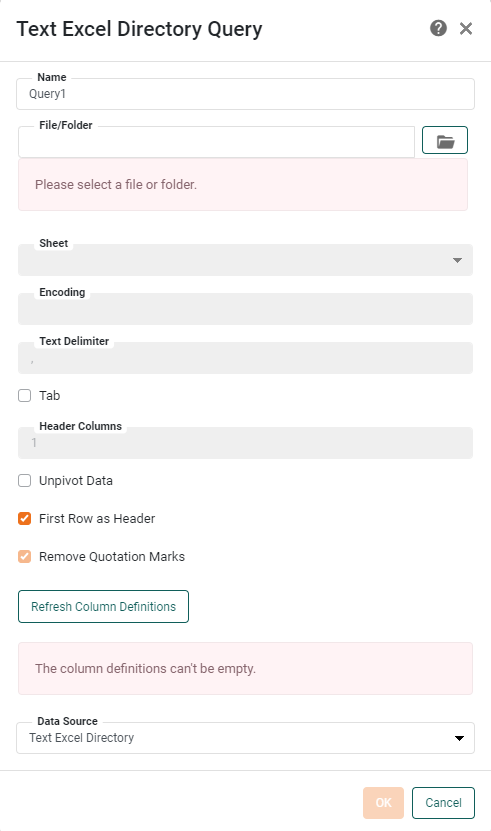
From the ‘File/Folder’ menu, select an Excel/CSV/Text file, or select a folder. If you select a folder, all files in the folder will be concatenated. If you select a file, specify the file properties using the additional controls. The options (‘Sheet’, ‘Encoding’, ‘Text Delimiter’, etc.) are the same as for uploading a file (see Upload Data in Prepare Your Data):
-
For an Excel file, use the ‘Sheet’ menu to choose the sheet that you want to import.
-
From the ‘Encoding’ menu, select the encoding of the text file.
-
In the ‘Delimiter’ field, enter the character that is used in the text file to separate entries. The default delimiter character is a comma. For tab-delimited files, select the ‘Tab’ option.
-
-
Adjust any of the following optional settings to modify the way the file data is interpreted:
-
Select ‘Unpivot Data (Crosstab Table)’ if the data in the file is in crosstab table form, and you want to convert the crosstab table into a regular table. This option will convert the column header row into a “dimension” column and convert the crosstab cells into a “measure” column. If the crosstab table in the file contains multiple levels of row headers, enter the number of levels in the ‘Header Columns’ field.
You can only unpivot a crosstab that has a single level of column headers. -
Select ‘First Row as Header (Regular Table)’ to use the entries in the first row of the file as the column header text. Otherwise, default column names are used (“col0,” “col1,” etc.).
-
Select ‘Remove Quotation Marks’ to strip quotation marks out of the text file upon loading.
-
-
Optional: If you have more than a one data source of this type defined, you can select an alternate data source from the ‘Data Source’ menu.
-
Press OK. This creates a new data block in the Data Worksheet.
-
Optional: Right-click on the data block, and select ‘Properties’ from the context menu. Note: You can also access menu options from the ‘More’ button (
 ) in the mini-toolbar. This opens the ‘Table Properties’ panel. In the ‘Name’ field, enter a name for the data block, and press ‘OK’. (See Modify a Column for information about how to rename columns.
Names must be unique without respect to case (e.g., "num1" is the same name as "Num1"). -
Press the ‘Save’ button
 in the toolbar to save the Data Worksheet.
You can now do pipeline operations on this data, as described in Prepare Your Data, or you can proceed to create Dashboards based on this Data Worksheet. See Visualize Your Data for information about how to construct a Dashboard.