Axis Title Properties
|
The following sections explain how to edit and format an axis title.
Edit an Axis Title
To edit the text of an axis title, right-click the title text on a Chart axis, and select ‘Title Properties’ from the context menu. Note: You can also access menu options from the ‘More’ button ( ) in the mini-toolbar. This opens the ‘Title Properties’ panel.
Properties that offer the ‘Value Type’ button  can also be set by the user (‘Variable’) or by scripted logic (‘Expression’). See Dynamically Set Properties for more information. can also be set by the user (‘Variable’) or by scripted logic (‘Expression’). See Dynamically Set Properties for more information.
|
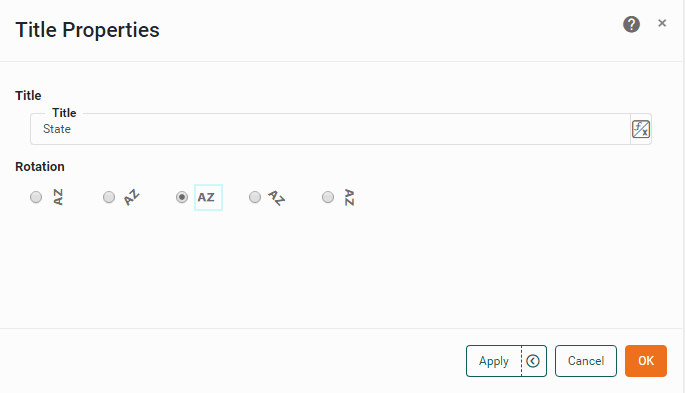
In the ‘Title’ field, enter the title for the axis. (The title text you enter will persist even if you later change the field displayed on that axis.) To add the default axis name into your custom title, insert a placeholder such as {0} in the title.
Press OK to close the panel and apply the changes.
|
To hide an axis title, right-click the title text on the chart, and select ‘Hide Title’ from the context menu. Note: You can also access menu options from the ‘More’ button () in the mini-toolbar. To show all axis titles, right-click on the chart, and select ‘Show All Titles’ from the context menu.
|
Format an Axis Title
To format an axis title, click the title text on the Chart to select it, and select the Format tab at the bottom of the left panel.
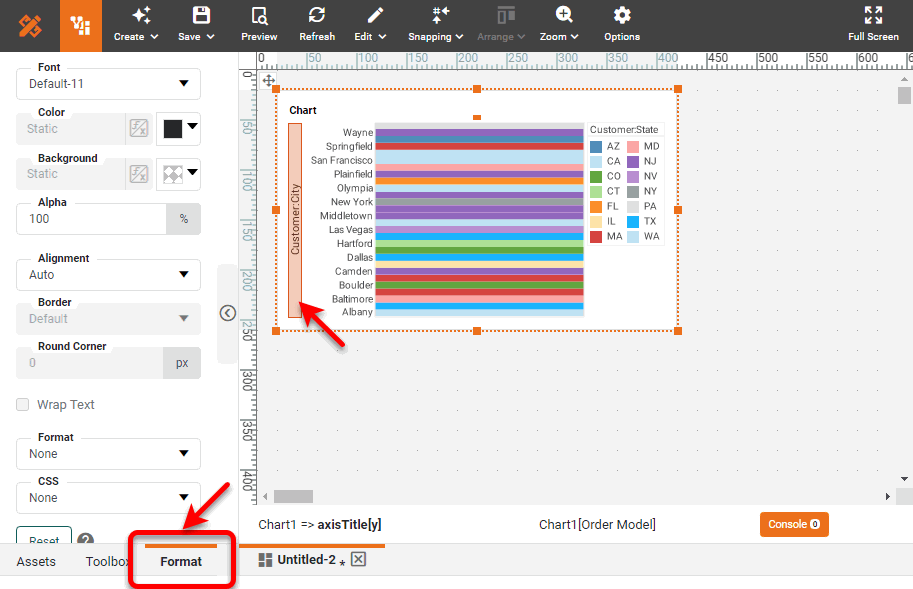
Select a font, color, alignment, etc., for the axis title. See Add Visual Format for more information about these options.