Change Chart Element Appearance
You can change the static appearance of chart elements by using a static VisualFrame. For example, you can set static colors, sizes, and textures to enhance the aesthetic appearance of a chart.
Consider the script below:
dataset = [["State","Quantity","Total"],["NJ",200,2500],["NY",300,1500]];
graph = new EGraph();
var elem = new PointElement("State", "Quantity");
graph.addElement(elem);
Script that modifies the graph or dataset properties should be placed on the Chart component itself. See Add Component Script for more information. This script has access to the Chart data and Chart API methods. Scripted Charts are not good candidates for user-modification, so you should deselect ‘Enable Ad Hoc Editing’ in the Chart Properties dialog box.
|
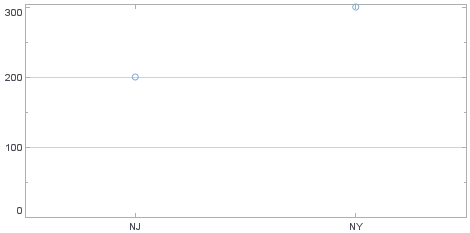
This creates a basic point (scatter) chart displaying the dimensions ‘State’ and ‘Quantity’. However, the points are rather small and hard to see. To increase the size of the points and assign them a bolder color, use a StaticColorFrame and a StaticSizeFrame.
Follow these steps:
-
Create a new
StaticColorFrameobject, and specify a static color (red).var cframe = new StaticColorFrame(); cframe.setColor(java.awt.Color(0xff0000)); // red -
Create a new
StaticSizeFrameobject, and specify a static size.var sframe = new StaticSizeFrame(); sframe.setSize(10); -
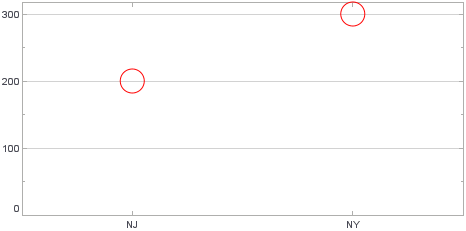
Assign the
StaticColorFrameandStaticSizeFrameobjects to the GraphElement object.elem.setColorFrame(cframe); elem.setSizeFrame(sframe);The points are now large and red.
Because these are static VisualFrames, the color and size are not keyed to the data. To represent data values using color, size, or other visual attributes, see Represent Data with Shape, Color, Size.