TriCoord
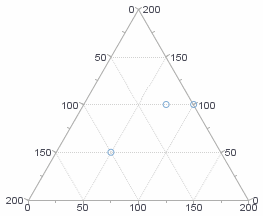
The TriCoord object contains triangular coordinates against which data can be represented. Although the triangular coordinate system contains three axes, it represents only two independent measures, because the three measures must sum to the maximum value of the scale. This makes the triangular coordinates effective for representing proportions of a fixed total.
| The three measures must sum to the maximum value of the scale. |
To create a TriCoord object, call the TriCoord constructor:
var coord = new TriCoord(qscale);You can pass a Scale object (e.g., ‘qscale’) to the constructor, or specify this later using the TriCoord.setScale(scale) property.
Example
Chart Component Script
dataset = [["Quantity","Total","Returns"],[50,50,100],[75,100,25],[100,100,0]]; (1)
graph = new EGraph();
var elem = new PointElement();
var qscale = new LinearScale("Quantity"); (2)
qscale.setMin(0);
qscale.setMax(200);
var spec = new AxisSpec();
spec.setGridStyle(Chart.DOT_LINE);
qscale.setAxisSpec(spec);
var coord = new TriCoord(qscale); (3)
elem.addDim("Quantity"); (4)
elem.addDim("Total"); (5)
elem.addVar("Returns"); (6)
graph.addElement(elem);
graph.setScale("Quantity", qscale);
graph.setScale("Total", qscale);
graph.setScale("Returns", qscale);
graph.setCoordinate(coord); (7)| 1 | See dataset to use a data block instead of an array literal. |
| 2 | Create the Scale object. |
| 3 | Create the TriCoord object from the Scale object. |
| 4 | Add first measure (‘Quantity’), represented on the bottom axis. |
| 5 | Add second measure (‘Total’), represented on the right axis. |
| 6 | Add third measure (‘Returns’), represented on the left axis. Note: The third measure must be added using GraphElement.addVar(field) rather than GraphElement.addDim(field). |
| 7 | Use EGraph.setCoordinate(coord) to add the RectCoord to the Chart. |
Script that modifies the graph or dataset properties should be placed on the Chart component itself. See Add Component Script for more information. This script has access to the Chart data and Chart API methods. Scripted Charts are not good candidates for user-modification, so you should deselect ‘Enable Ad Hoc Editing’ in the Chart Properties dialog box.
|