Crosstab Properties
|
The ‘Crosstab Properties’ panel provides General, Advanced, Hierarchy, and Script tabs. The next sections discuss the Crosstab-specific properties available under these tabs.
General Tab
The General tab in the ‘Crosstab Properties’ panel is the same as for regular Tables. See Table Properties.
Advanced Tab
The Advanced tab in the ‘Crosstab Properties’ panel provides the following properties. Some properties apply to Freehand Table as well.
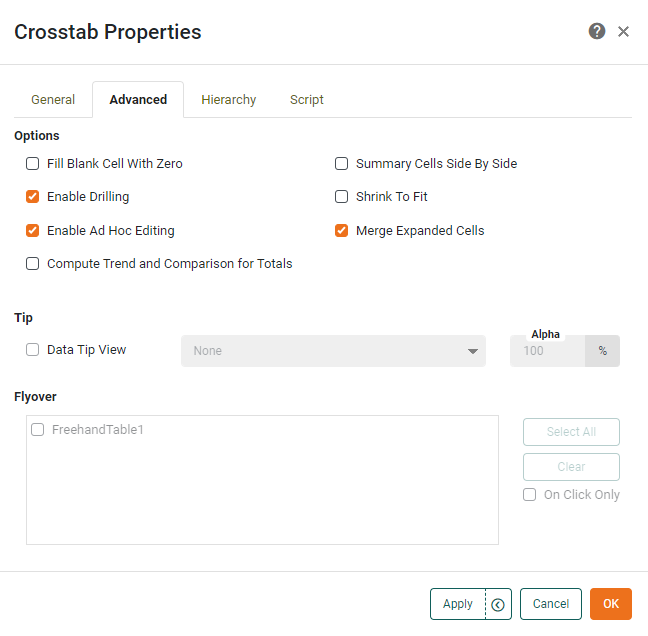
- Fill Blank Cell With Zero
-
Places a zero value in measure cells corresponding to row and column heading combinations for which no records exist. Otherwise, these cells are simply left blank.
- Summary Cells Side By Side
-
Places multiple aggregated measures side-by-side, rather than stacking them vertically.
- Enable Drilling
-
Allows the user to drill up and down in date or dimension fields. See Drill Down into Data for more information.
- Enable Ad Hoc Editing
-
Allow end users to access the Crosstab Editor and edit the table.
- Enable Date Comparison
-
Enables the Date Comparison feature for the Crosstab. See Compare Data by Date for more details.
- Sort Others Last
-
Available when ‘Group all others together’ is enabled for Top/Bottom ranking in the ‘Edit Dimension’ panel of the Crosstab or Freehand Table Editor. (See Create a Crosstab and Create a Freehand Table for information about dimension ranking.) When enabled, this property places the ‘Others’ group after all the ranked groups, regardless of the specified dimension sorting.
- Merge Expanded Cells
-
Merge automatically expanded cells into a single cell. This is a useful way to simplify the table when expanded cells all contain the same text, or when borders between the cells are undesirable.
- Compute Trend and Comparison for Totals
-
Apply the ‘Trend and Comparison’ setting to automatically-computed grand totals as well as to the specified aggregates. See Trend and Compare Data for more information about the available settings.
- Shrink to Fit
-
When enabled, this reduces the height of the table to match the number of records displayed, and allows final column width to be set manually. For example, if the original table height (as designed) was 10 rows, and the user then makes selections which restrict the result set to five rows, the bottom table border retracts or “shrinks” to eliminate any empty rows at the bottom of the table.
- Data Tip View
-
A Dashboard component is displayed when mouse hovers over the Crosstab or Freehand Table. The component is filtered based on the hover region. See Add Tips to a Chart for more details.
- Flyover Views
-
Allows you to select a set of Dashboard components which will be adaptively filtered as the user hovers the mouse or clicks on the Crosstab or Freehand Table. (Select ‘On Click Only’ if you want the filtered components to update when the user clicks.) See Drill Down into Data for more details.
Hierarchy Tab
Watch Video: Grouping Data in a Dashboard (Add Hierarchy to Crosstab)
This video might show an earlier version of the feature or operation that differs in minor ways from the current version.
The Hierarchy tab in the ‘Crosstab Properties’ panel allows you to specify the hierarchy for a custom drill-down. The procedure for this is the same as that for a Chart. See Chart Properties for details. For information on how to navigate a crosstab with drill-downs, see Drill Down into Data.
Script Tab
See Script Tab for information about this common tab.