CategoricalColorFrame.init(val[,color])
Initialize the ColorFrame with a set of categorical values and (optionally) colors.
Parameter
- val
-
array of categorical initialization values,
or name of field containing categorical values - color
-
array of colors corresponding to value array
Example 1
Chart Component Script
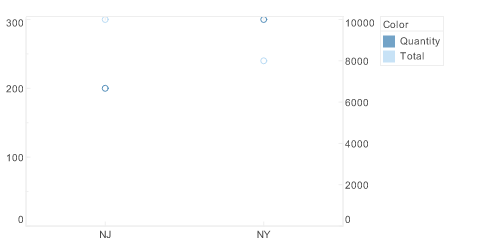
dataset = [["State","Quantity","Total"], ["NJ",200,10000], ["NY",300,8000]]; (1)
graph = new EGraph();
var elem = new PointElement("State", "Quantity");
var elem2 = new PointElement("State", "Total");
var cframe = new CategoricalColorFrame(); (2)
cframe.init("Quantity", "Total"); (3)
elem.setColorFrame(cframe); (4)
elem2.setColorFrame(cframe); (4)
var sscale = new CategoricalScale("State");
var qscale = new LinearScale("Quantity");
var qscale2 = new LinearScale("Total");
var coord = new RectCoord();
coord.setXScale(sscale);
coord.setYScale(qscale);
coord.setYScale2(qscale2);
graph.setCoordinate(coord);
graph.addElement(elem);
graph.addElement(elem2);| 1 | See dataset to use a data block instead of an array literal. |
| 2 | Create the ColorFrame object. |
| 3 | Use init to initialize ColorFrame with value only. |
| 4 | Use GraphElement.getColorFrame() to add the ColorFrame to the elements. |
Script that modifies the graph or dataset properties should be placed on the Chart component itself. See Add Component Script for more information. This script has access to the Chart data and Chart API methods. Scripted Charts are not good candidates for user-modification, so you should deselect ‘Enable Ad Hoc Editing’ in the Chart Properties dialog box.
|
|
To change the property on a Chart that was previously created with the Chart Editor, use “getter” methods such as EGraph.getElement(index) ① to obtain a handle to the desired GraphElement object. For example: |
Example 2
Chart Component Script
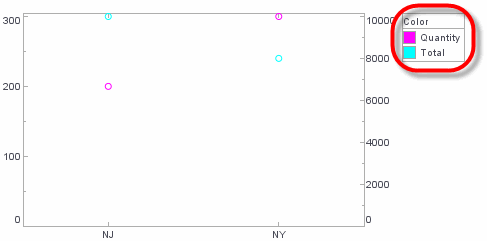
dataset = [["State","Quantity","Total"], ["NJ",200,10000], ["NY",300,8000]]; (2)
graph = new EGraph();
var elem = new PointElement("State", "Quantity");
var elem2 = new PointElement("State", "Total");
var cframe = new CategoricalColorFrame(); (2)
cframe.init(["Quantity","Total"],[java.awt.Color(0xff00ff),java.awt.Color(0x00ffff)]); (3)
elem.setColorFrame(cframe); (4)
elem2.setColorFrame(cframe); (4)
var sscale = new CategoricalScale("State");
var qscale = new LinearScale("Quantity");
var qscale2 = new LinearScale("Total");
var coord = new RectCoord();
coord.setXScale(sscale);
coord.setYScale(qscale);
coord.setYScale2(qscale2);
graph.setCoordinate(coord);
graph.addElement(elem);
graph.addElement(elem2);| 1 | See dataset to use a data block instead of an array literal. |
| 2 | Create the ColorFrame object. |
| 3 | Use init to initialize ColorFrame with value and color. |
| 4 | Use GraphElement.getColorFrame() to add the ColorFrame to the elements. |
Script that modifies the graph or dataset properties should be placed on the Chart component itself. See Add Component Script for more information. This script has access to the Chart data and Chart API methods. Scripted Charts are not good candidates for user-modification, so you should deselect ‘Enable Ad Hoc Editing’ in the Chart Properties dialog box.
|