GraphForm.setMeasure(col)
Specifies the measure for which the form should be displayed. If the Chart contains a measure of this name, the GraphForm object is displayed. Otherwise, it is not displayed. This is useful for FacetCoord Charts, when the GraphForm should be displayed only for the Chart that represents a particular measure. The corresponding “getter” function is getMeasure().
Example
Chart Component Script
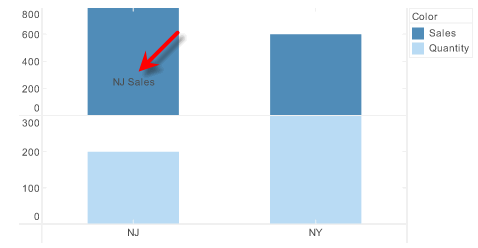
dataset = [["State", "Quantity", "Sales"], ["NJ", 200, 800], ["NY", 300, 600]]; (1)
graph = new EGraph();
var elem = new IntervalElement("State", "Quantity");
var elem2 = new IntervalElement("State", "Sales");
var form = new LabelForm(); (2)
form.setValues(['NJ',200]);
form.setLabel("NJ Sales");
form.setAlignmentX(Chart.CENTER_ALIGNMENT);
form.setMeasure("Sales"); (3)
graph.addForm(form); (4)
var scale = new CategoricalScale("State");
var qscale = new LinearScale("Quantity");
var sscale = new LinearScale("Sales");
var qcoord = new RectCoord(scale, qscale);
var scoord = new RectCoord(scale, sscale);
var facet = new FacetCoord();
facet.setInnerCoordinates([qcoord, scoord]);
graph.setCoordinate(facet);
graph.addElement(elem);
graph.addElement(elem2);| 1 | See dataset to use a data block instead of an array literal. |
| 2 | Create the GraphForm object. |
| 3 | Use setMeasure() to display the GraphForm only for the ‘Sales’ measure. |
| 4 | Use EGraph.addForm(form) to add the GraphForm to the Chart. |
Script that modifies the graph or dataset properties should be placed on the Chart component itself. See Add Component Script for more information. This script has access to the Chart data and Chart API methods. Scripted Charts are not good candidates for user-modification, so you should deselect ‘Enable Ad Hoc Editing’ in the Chart Properties dialog box.
|