TextSpec.setFormat(format)
Specifies how date or numeric data should be represented in string format for display. The corresponding “getter” function is getFormat().
Parameter
- format
-
java.text.Format or
inetsoft.util.ExtendedDecimalFormat
Date Format
For date formatting, use the following date masks:
M = Month
d = date
y = year
E = day of the week| Date masks are described in the Date Format section. |
For the date Nov 8, 2006:
M = 11; MM = 11; MMM = Nov; MMMM = November
d = 8; dd = 08
yy = 06; yyyy = 2006
EEE = Wed; EEEE = Wednesday
Therefore, the mask MMM-dd-yyyy yields the string “Nov-08-2006”.
Number Format
For number formatting, use the following numeric masks:
# = Number
0 = Number with zero padding
Numeric masks are described in the Number Format section. If the format uses a multiplier such as K, M, or B (e.g., "#,##0.0M"), use inetsoft.util.ExtendedDecimalFormat in place of java.text.DecimalFormat to scale the values appropriately.
|
 #,###.## = 124,521.63    (1)
 #,###.000 = 124,521.630  (2)
| 1 | Insert comma every three places |
| 2 | Pad to hundredths by using ‘0’ to right of decimal |
 #,###.## = 745,850.78       (1)
 #.# = 745850.8              (2)
#,###.000 = 745,850.780 (3)| 1 | Insert comma every three places |
| 2 | Round to tenths by using ‘#’ to right of decimal |
| 3 | Pad to hundredths by using ‘0’ to right of decimal |
Text Format
For text formatting, use {0} as a placeholder for the string data.
For the string 'Susan', the Text Format Salesperson: {0} yields:
Salesperson: Susan
The Text Format --{0}-- yields:
--Susan--
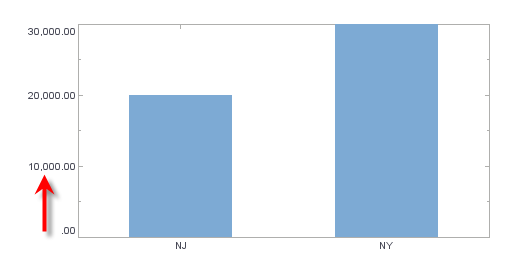
Example
dataset = [["State","Quantity"],["NJ",20000],["NY",30000]]; (1)
graph = new EGraph();
var elem = new IntervalElement("State", "Quantity");
var qscale = new LinearScale("Quantity");
var aspec = new AxisSpec();
var tspec = new TextSpec(); (2)
tspec.setFormat(java.text.DecimalFormat("##,###.00")); (3)
aspec.setTextSpec(tspec); (4)
qscale.setAxisSpec(aspec);
graph.setScale("Quantity", qscale);
graph.addElement(elem);| 1 | See dataset to use a data block instead of an array literal. |
| 2 | Create the TextSpec object. |
| 3 | Use setFormat() to assign the number format to the TextSpec. |
| 4 | Use AxisSpec.setTextSpec(spec) to assign the TextSpec to the AxisSpec. |
Script that modifies the graph or dataset properties should be placed on the Chart component itself. See Add Component Script for more information. This script has access to the Chart data and Chart API methods. Scripted Charts are not good candidates for user-modification, so you should deselect ‘Enable Ad Hoc Editing’ in the Chart Properties dialog box.
|
|
To change the property on a Chart that was previously created with the Chart Editor, use “getter” methods such as EGraph.getCoordinate() ①, RectCoord.getYScale() ②, Scale.getAxisSpec() ③, and AxisSpec.getTextSpec() ④ to obtain a handle to the desired Coordinate, Scale, AxisSpec, and TextSpec. For example: |