addPercentageTarget(measure, colors, values, options)
Draws a set of horizontal or vertical lines on the chart to mark the specified percentage figures. See Add a Target Line/Curve Fit for more information about target lines.
Individual target lines are accessed in script as GraphForm objects. To remove a specific target line, use graph.removeForm(index). Indexing for all GraphForm objects begins at 0 and proceeds in the order that objects were added to the chart. To remove all target lines, use clearTargets().
|
Parameter
- measure
-
Name of measure on which to draw percentage lines
- colors
-
Color (see valueColor) or array of colors to fill areas between percentage lines
- values
-
Percentage, or array of percentages, at which to draw lines
- options
-
Object literal containing name-value pairs of options (see Options below, e.g.,
{fillAbove:0xff0000, fillBelow:0x00ff00})
Options
- fillAbove
-
Color (see valueColor) to fill the region above the upper percentage line
- fillBelow
-
Color (see valueColor) to fill the region below the lower percentage line
- label
-
String, or array of strings, to label the percentage line(s). The following codes can be inserted:
{0}: Target value
{1}: Target formula
{2}: Field name
The code can be followed by a format type and format string, for example,
{0,number,$#,##0}. See Add Data Format for more information about formatting. - lineColor
-
Color (see valueColor) to apply to all percentage lines
- lineStyle
-
The line style (a Line Style constant) to apply to all percentage lines
- labelFont
-
The font description (e.g.,
'Lucida Sans Unicode-BOLD-14') to apply to all line labels - labelColor
-
The color (see Line Style) to apply to all line labels
- percentageAggregate
-
The basis on which to compute the percentage:
'Average','Minimum','Maximim','Median','Sum'.
Examples
// The 'options' object is broken into several lines for clarity:
var options = {fillAbove:[225,225,225],fillBelow:[225,225,225], \
label:['{1}: {0,number,$#,##0}'],lineColor:'red',lineStyle:Chart.THICK_LINE, \
labelFont:'Lucida Sans Unicode-BOLD-11',labelColor:'black', \
percentageAggregate:'Average'}
Chart1.addPercentageTarget('Sum(Product:Total)','null',125,options)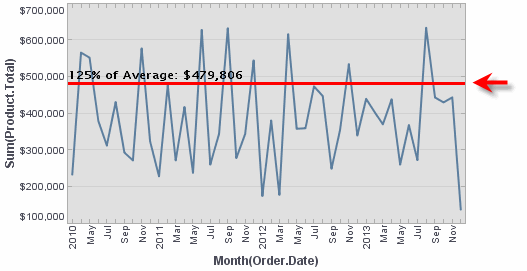
// The 'options' object is broken into several lines for clarity:
var options = {fillAbove:[225,225,225],fillBelow:[225,225,225], \
label:['{1}: {0,number,$#,##0}','{1}: {0,number,$#,##0}'],lineColor:'red', \
lineStyle:Chart.THICK_LINE,labelFont:'Lucida Sans Unicode-BOLD-11', \
labelColor:'black',percentageAggregate:'Maximum'}
Chart1.addPercentageTarget('Sum(Product:Total)',[0xDDAAAA,0xDDCCCC],[30,60,90],options)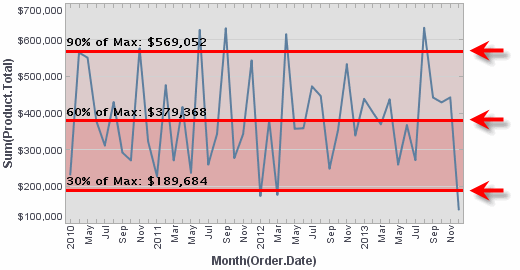
|
Either syntax below can be used in component script: For onInit/onRefresh scripts, and for component and property scripts on other components, the second (qualified) form is required. |