Create a New Data Field
You can create a new data field with one of the following two approaches.
Create an Expression Column in a Data Worksheet
Watch Video: Create a New Data Field in a Data Block
This video might show an earlier version of the feature or operation that differs in minor ways from the current version.
An expression column is a data set column that you define using either JavaScript or SQL (for SQL data sources). The expression is evaluated for each row of the data set. (You can use the row keyword to access the current row number within the expression.) Creating an expression column in a Data Worksheet allows you to reference the field in any Dashboard that uses the Data Worksheet. SQL expressions can often also be executed more efficiently (for SQL data sources) than JavaScript expressions.
To add an expression column to a data block, follow the steps below:
-
Create the data block to which you want to add an expression column. See Create a Data Worksheet for information on how to create a data block.
-
Click the data block to select it.
If the data block is grouped and aggregated, use the ‘Change View’ button  to switch the view to either ‘Meta Detail View’
  or ‘Live Detail View’
  . (See Preview Data for more information.)
-
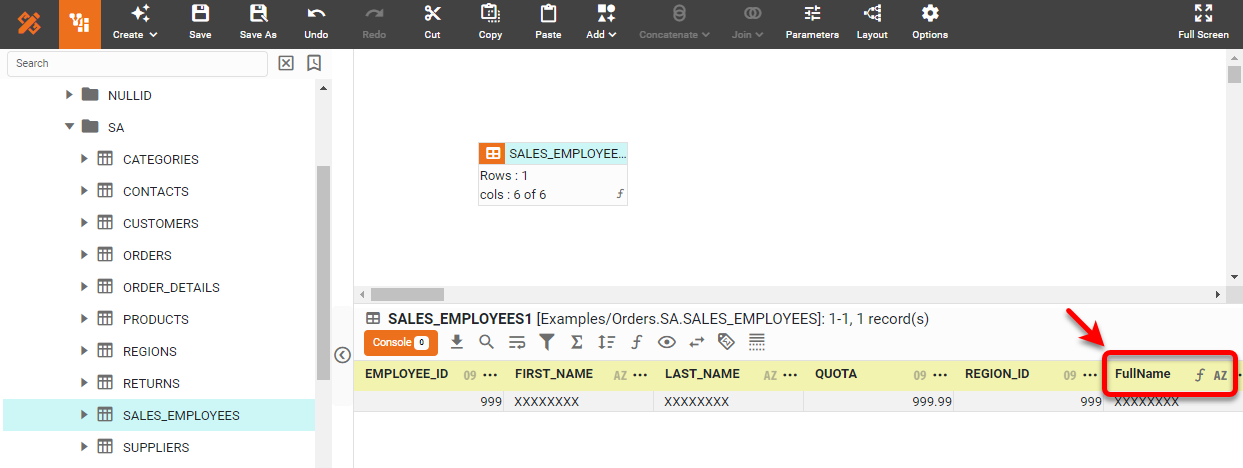
In the bottom panel, press the ‘Create Expression’ button
 . This opens the Formula Editor.
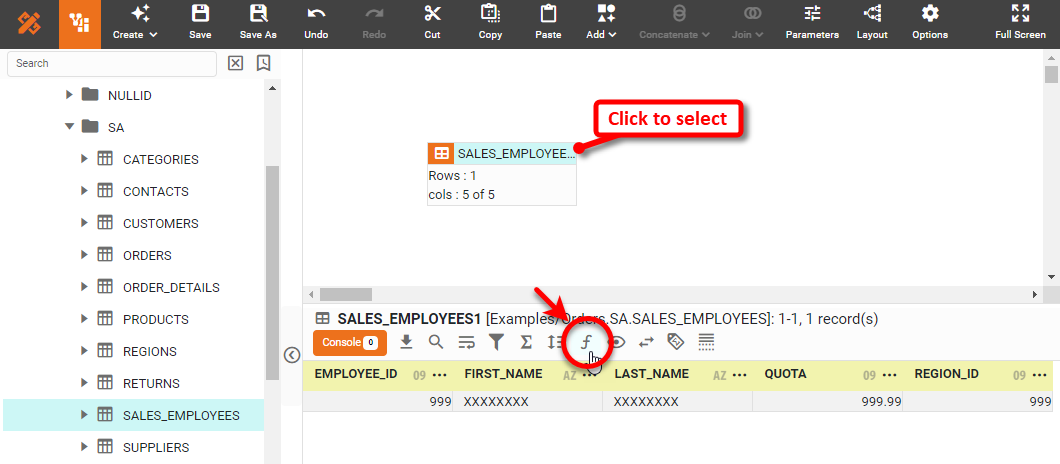
-
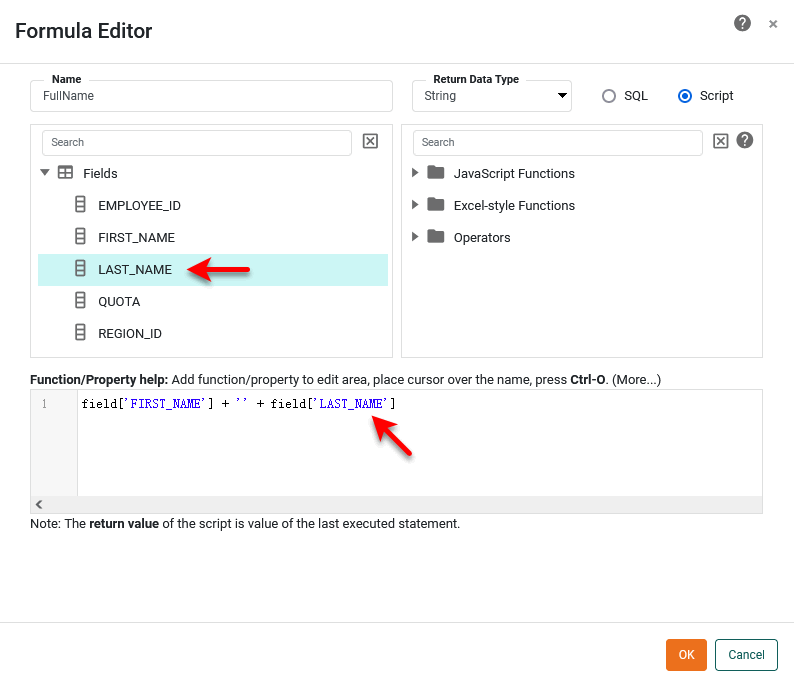
In the ‘Name’ field, enter the name of the new column that the expression will create.
Names must be unique without respect to case (e.g., "num1" is the same name as "Num1"). -
At the top of the Formula Editor, select either ‘SQL’ or ‘Script’. Select ‘SQL’ (if available) to write the expression using your database’s SQL syntax. Select ‘Script’ to write the expression using JavaScript. Note: This setting must match the expression syntax that you enter or the expression column will generate an error.
-
From the ‘Return Data Type’ menu, select the appropriate data type for the values that the expression will return.
Setting an incorrect ‘Return Data Type’ may cause the expression to return unexpected results. -
Type the desired expression into the script area. To add a field into the expression, click on the field name in the ‘Fields’ listing. To reference the data contained in other cells of the data block, see Access Data in Expression.
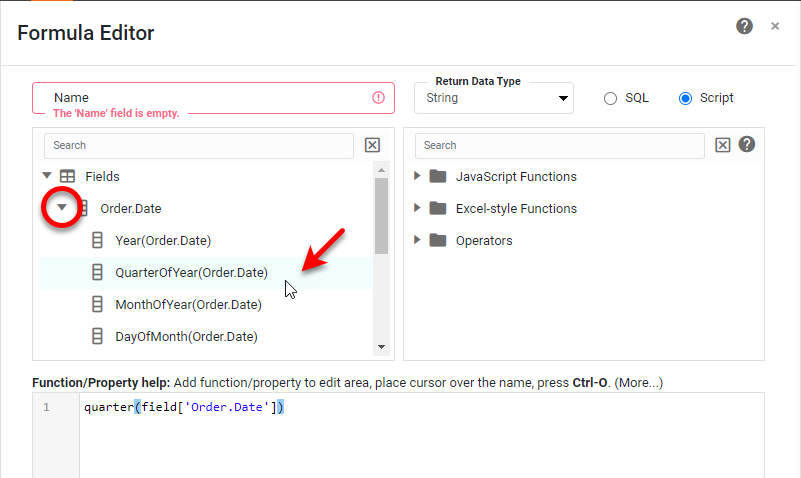
If you select the ‘Script’ option, Date-type fields supply the following date parts: Year, QuarterOfYear, MonthOfYear, DayOfMonth, and DayOfWeek. Time-type fields supply the following date parts: HourOfDay, MinuteOfHour, SecondOfMinute. TimeInstant-type fields supply all the previous date parts.
To compute date parts using a fiscal calendar, use fiscal functions such as CALC.fiscalweek and CALC.fiscalmonth in the Formula Editor. -
Press OK to close the Editor and create the new column.
-
Save the Data Worksheet by pressing the ‘Save’ button
 in the toolbar or press Ctrl+S on the keyboard.
You can now use this Data Worksheet to supply the dataset for a Dashboard. See Visualize Your Data to create a Dashboard.
Create a Calculated Field in a Dashboard
Watch Video: Add a New Data Field to a Dashboard
This video might show an earlier version of the feature or operation that differs in minor ways from the current version.
If your data source does not provide data in the correct form for display on the Dashboard, use a calculated field to create the desired data field. Unlike the expression column described above, a calculated field is available only to the Dashboard in which defined, and it can operate both on detail data and on data that is being aggregated within the Dashboard (for example, in charts and crosstabs).
To create a new calculated field, follow the steps below:
-
Edit the Dashboard to which you want to add an expression field. See Edit a Dashboard.
-
In the Toolbox panel, right-click on the data block or data model to which you want to add the calculated field. Select ‘New Calculated Field’ from the context menu.
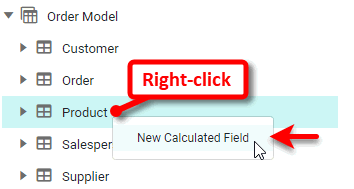
This opens the ‘Calculated Field’ panel.
-
In the ‘Name’ field, enter a name for the new calculated field.
Name restrictionsThe following special characters are permitted in the name of a calculated field: Period ("."), comma (","), question mark ("?"), parentheses ("()"), exclamation point ("!"), at sign ("@"), ampersand ("&"), single quote (" ' "). Slash("/") is not permitted. -
Select the ‘Detail’ option to perform calculations on the data directly provided by the data block, or click ‘Aggregate’ to perform calculations on the data after it has been aggregated (for example in a Chart or a Crosstab). See below for examples of detail and aggregate calculations.
Your choice of ‘Detail’ or ‘Aggregate’ cannot be changed later. 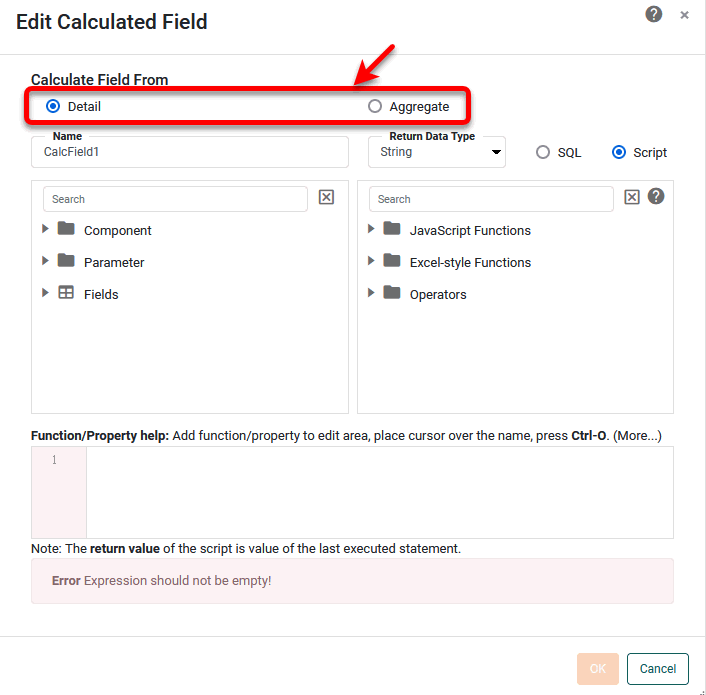
-
In the ‘Return Data Type’ menu, select the data type that the calculated field will return.
-
Enable the ‘SQL’ option to construct the formula using SQL syntax. Disable the ‘SQL’ option to construct the formula using JavaScript syntax.
In general, SQL expressions perform better than JavaScript expressions because SQL expressions can be optimized for processing on the database whereas JavaScript expressions must be post-processed by the server. However, JavaScript provides greater programmatic flexibility and allows construction of expressions that are difficult or impossible to implement within the constraints of SQL.
-
Enter the desired calculation into the formula field at the bottom of the dialog box. The sections below explain how to construct detail and aggregate calculations:
-
Press OK to close the Formula Editor. This adds the new calculated field to the data source at the top of the Toobox panel.
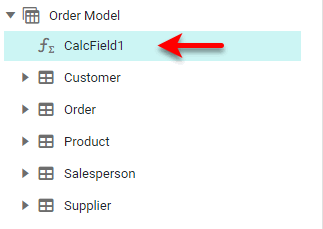
You can display this calculated field in Output Components (see Add a KPI) or Data View Components (see Create a Chart and Create a Table) in the same way that would display any other data field.
| You cannot bind an aggregate-based calculated field to Filter components. |
Detail-Level Calculation
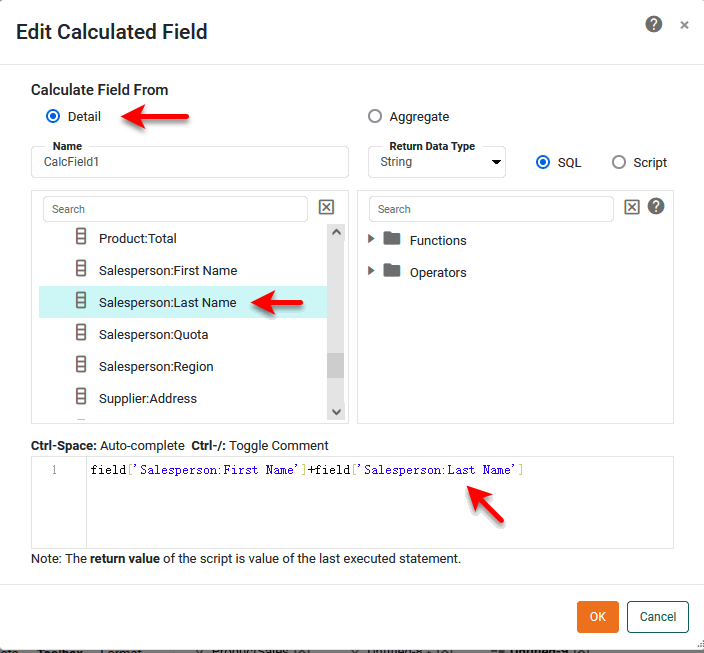
See Create a Calculated Field in a Dashboard to open the ‘Edit Calculated Field’ dialog box, and select the ‘Detail’ option. The available detail fields are listed in the top-left panel. Click on an available field in the panel to add it to the expression.
| Date-type fields supply the following date parts: Year, QuarterOfYear, MonthOfYear, DayOfMonth, and DayOfWeek. Time-type fields supply the following date parts: HourOfDay, MinuteOfHour, SecondOfMinute. TimeInstant-type fields supply all of the previous date parts. |
Many expressions are similar to formulas that you might use in Microsoft Excel®. Some common examples are shown below.
- CALC.monthname(date)
-
Obtain the name of the month from a date field.
CALC.monthname(field['Date']) - CALC.fiscalweek(date, startMonth, startDay)
-
Obtain the number of the fiscal week for a year starting on a specified date (e.g., April 16).
CALC.fiscalweek(CALC.today(), 4, 16) - dateAdd(interval, amount, date)
-
Add or subtract a specified number of days, months, or years from a date field.
dateAdd('m',-1,field['Date']) // Subtract one month from the value in the date field - dateDiff(interval, date1, date2)
-
Return the difference in days, months, or years between two dates.
dateDiff('d',field['Date'],CALC.now()) // Return the days elapsed from the Date value until today - CALC.now()
-
Return the current date and time. Often used with a date operator such as dateDiff() or dateAdd().
dateDiff('d',field['Date'],CALC.now())
// Return the days elapsed from the Date value until today
- CALC.round(number, num_digits)
-
Round a numerical value to a specified number of decimal places.
CALC.round(field['Total'],2) - CALC.sqrt(number)
-
Compute the square root of a value.
CALC.sqrt(field['Total'])
- CALC.proper(string)
-
Convert a string to “proper” case (initial caps):
CALC.proper(field['Description']) - CALC.trim(string)
-
Remove extra whitespace from a string.
CALC.trim(' Mary had a little lamb.') // returns “Mary had a little lamb”. - CALC.len(string)
-
Return the length of a string, including spaces.
CALC.len(field['Company']) - CALC.concatenate(array)
-
Concatenate strings.
CALC.concatenate([field['First_Name'],' ',field['First_Name']]); // Or use the JavaScript concatenation operator, “+”: field['First_Name'] + field['First_Name'] - CALC.left(string, num_chars)
-
Return a specified number of characters from the left side of a string:
CALC.left(field['Category'], 4);
// Return the first four characters of each category name
- CALC.iif(condition, value_if_true, value_if_false)
-
Test a condition to determine a return value:
CALC.iif(field['Total']>500,'big sale','small sale') // Return ”big sale” if Total > $500, otherwise “small sale” // Or use the JavaScript ternary operator: field['Total']>500 ? 'big sale' : 'small sale' - CALC.and(Boolean_1, Boolean_2, …, Boolean_n)
-
Return “true” if two or more conditions are simultaneously true. Often used together with a conditional operator such as iif.
CALC.and(field['Total']>200, field['Quantity Purchased']<10)
// Return true if Total > $200 AND Quantity is less than 10
// Or use the JavaScript “and” operator:
(field['Total']>200) && (field['Quantity Purchased']<10)
Aggregate-Level Calculation
An aggregate calculation field is a predefined aggregation formula that you can use in a component that aggregates data such as a Gauge, Text, Chart, or Crosstab. Typically, the calculation involves more than one data field.
See Create a Calculated Field in a Dashboard to open the ‘Edit Calculated Field’ dialog box, and select the ‘Aggregate’ option. The Formula Editor may already contain the desired aggregate fields in the top-left panel. Click on an available field in the panel to add it to the expression.
To add a new aggregate to the list, follow the steps below:
-
Press the ‘New Aggregate’ link in the top-left panel.
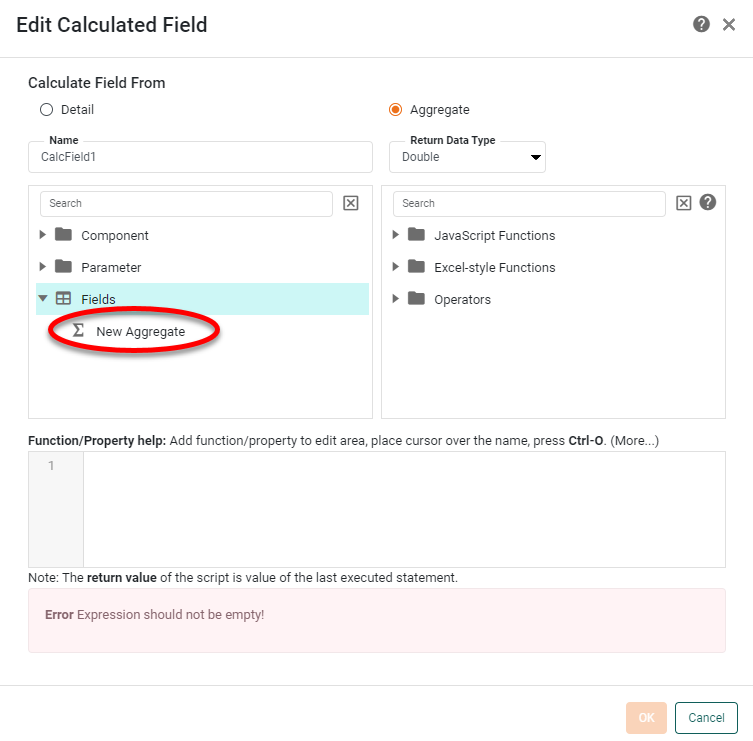
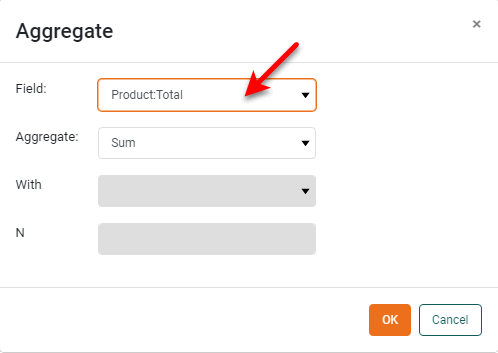
This opens the ‘Aggregate’ dialog box.
-
In the ‘Field’ menu of the ‘Aggregate’ dialog box, select the field that you wish to aggregate for purposes of the calculation.
-
In the ‘Aggregate’ menu, select the desired aggregation method.
Read about the available aggregation methods…
The list below describes the available Data Block, Crosstab, and Chart aggregation measures. You can choose to display univariate aggregations (e.g., ‘Sum’, ‘Count’) as a percentage value by selecting the percentage basis (e.g., ‘Group’, ‘GrandTotal’) from the accompanying ‘Percentage’ or ‘Percentage of’ menu. For the bivariate aggregation methods (e.g., ‘Correlation’, ‘Weighted Average’), you will need to select a variable (column) to use as the second operand in the computation. Make this selection in the menu labeled ‘with’.
- Sum
-
Displays the sum of the measure values for the given group.
- Average
-
Displays the average of the measure values for the given group.
- Max
-
Displays the maximum of the measure values for the given group. For dates, this will return the latest date.
- Min
-
Displays the minimum of the measure values for the given group. For dates, this will return the earliest date.
- Count
-
Displays the total count of measure values for the given group. This represents the total number of records corresponding to the given group, and is the same value for any selected measure.
- Distinct Count
-
Displays the count of unique measure values for the given group.
- First
-
Displays the first value for the measure (for the given group) when sorted based on the values in a second column, specified by the menu labeled ‘by’.
- Last
-
Displays the last value for the measure (for the given group) when sorted based on the values in a second column, specified by the menu labeled ‘by’.
- Correlation
-
Displays the Pearson correlation coefficient for the correlation between the measure values (for the given group) and the corresponding values in a second column, specified by the menu labeled ‘with’.
- Covariance
-
Displays the covariance between the measure values (for the given group) and the corresponding values in a second column, specified by the menu labeled ‘with’.
- Variance
-
Displays the (sample) variance of the measure values for the given group.
- Std Deviation
-
Displays the (sample) standard deviation of the measure values for the given group.
- Variance (Pop)
-
Displays the (population) variance of the measure values for the given group.
- Std Deviation (Pop)
-
Displays the (population) standard deviation of the measure values for the given group.
- Weighted Average
-
Displays the weighted average of the measure values for the given group. The weights are given by the corresponding values in a second column, which is specified by the menu labeled ‘with’.
- Median
-
Displays the median (middle) of the measure values for the given group.
- Mode
-
Displays the mode (most common) of the measure values for the given group.
- Product
-
Displays the product (multiplication) of the measure values for the given group.
- Concat
-
Displays the concatenation into a comma-separated list of the measure values for the given group.
- NthLargest
-
Displays the Nth largest of the measure values for the given group.
- NthSmallest
-
Displays the Nth smallest of the measure values for the given group.
- NthMostFrequent
-
Displays the Nth most common of the measure values for the given group.
- PthPercentile
-
Displays the value of the Pth percentile for the measure values for the given group.
-
For a bivariate aggregation method, select the second field from the ‘With’ menu.
-
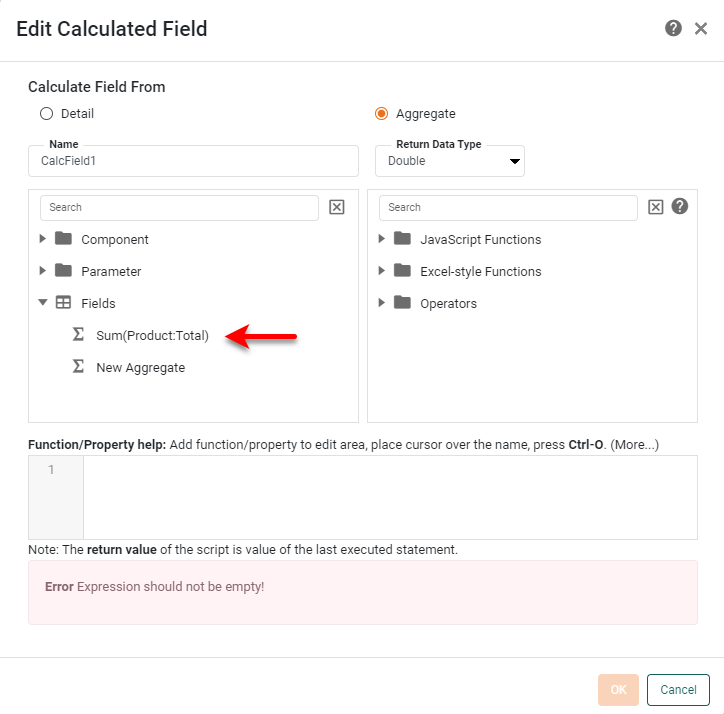
Press OK to close the ‘Aggregate’ dialog box. The Formula Editor now displays the newly defined aggregate quantity in the top-left panel.
-
Optional: Press the ‘New Aggregate’ button again, and repeat the above steps to add as many additional aggregates as desired. To delete an aggregate from the list, press the ‘Actions’ button
 to the right of the aggregate, and select ‘Delete’.
 -
Once you have defined the required aggregates in the top-left panel, enter the desired calculation (using the aggregate fields) in the formula field at the bottom of the dialog box.
Click an aggregate field in the top-left panel to add it to the expression. 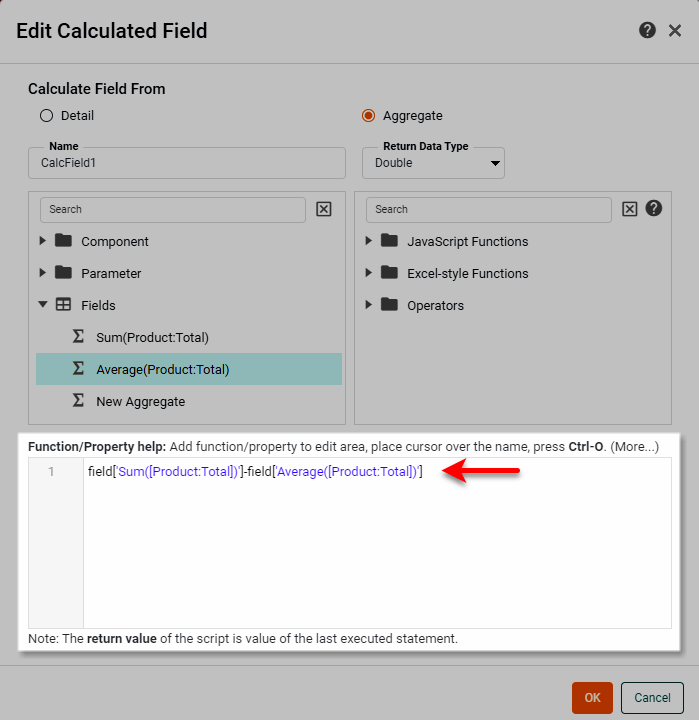
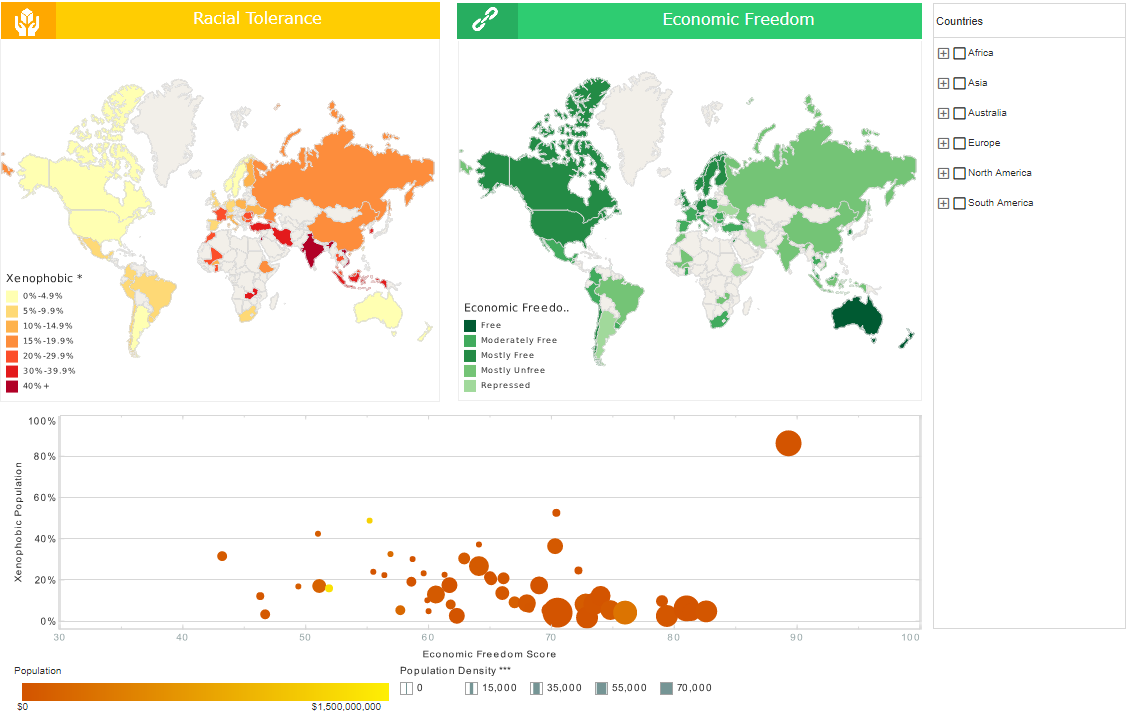
The sample Global Visual Analysis Dashboard provides an example of using calculated fields to color the regions on a map.
To explore this sample Dashboard, download and import the Global Visual Analysis Dashboard into your environment. (This requires access to Enterprise Manager.) See Import and Export Assets for instructions on how to import.