ScaleRange.setAbsoluteValue(Boolean)
Specifies whether negative quantities should be represented against the positive axis or against the negative axis (default).
Parameter
- Boolean
-
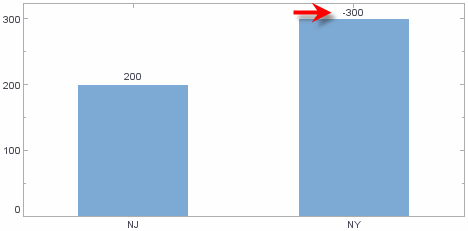
true: show negative values on positive axis
false: show negative values on negative axis
Example
Chart Component Script
dataset = [["State", "Quantity"], ["NJ",200], ["NY",-300]]; (1)
graph = new EGraph();
var qscale = new LinearScale("Quantity");
var elem = new IntervalElement("State", "Quantity");
var frame = new DefaultTextFrame();
frame.setField("Quantity");
elem.setTextFrame(frame);
var range = new LinearRange(); (2)
range.setAbsoluteValue(true); (3)
qscale.setScaleRange(range); (4)
graph.setScale("Quantity", qscale); (5)
graph.addElement(elem);| 1 | See dataset to use a data block instead of an array literal. |
| 2 | Create the LinearRange object. |
| 3 | Use setAbsoluteValue to show negative values on positive axis. |
| 4 | Use LinearScale.setScaleRange(range) to assign the LinearRange to the scale. |
| 5 | Use EGraph.setScale(field, scale) to add the scale to the Chart for the ‘Quantity’ axis. |
Script that modifies the graph or dataset properties should be placed on the Chart component itself. See Add Component Script for more information. This script has access to the Chart data and Chart API methods. Scripted Charts are not good candidates for user-modification, so you should deselect ‘Enable Ad Hoc Editing’ in the Chart Properties dialog box.
|
|
To change the property on a Chart that was previously created with the Chart Editor, use “getter” methods such as EGraph.getCoordinate() ①, RectCoord.getYScale() ②, and LinearScale.getScaleRange() ③ to obtain a handle to the desired Coordinate, Scale, and ScaleRange. For example: |