Change Axis Properties
To alter the appearance of chart axes, use the Chart’s EGraph.setScale(field, scale) method to assign a new Scale object. For example, you can replace a linear scale with a logarithmic scale, show or hide tick marks, display axis labels at top or right, change the label font and color, etc.
Consider the following Chart component script:
dataset = [["State","Quantity"], ["NJ",200], ["NY",3000]];
graph = new EGraph();
var elem = new IntervalElement("State", "Quantity");
graph.addElement(elem);
Script that modifies the graph or dataset properties should be placed on the Chart component itself. See Add Component Script for more information. This script has access to the Chart data and Chart API methods. Scripted Charts are not good candidates for user-modification, so you should deselect ‘Enable Ad Hoc Editing’ in the Chart Properties dialog box.
|
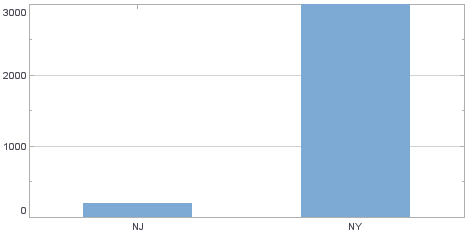
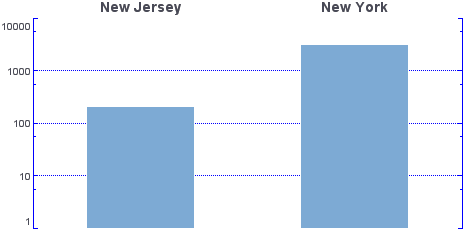
This creates a basic bar chart displaying the dimensions ‘State’ and ‘Quantity’. Follow the steps below to experiment with modifying the chart’s axes:
-
Create a new logarithmic scale using the LogScale object, specifying ‘Quantity’ as the field on which the scale is based.
var logscale = new LogScale('Quantity'); -
Set the color of the Y-axis lines and gridline to blue, and make the gridlines dotted. To do this, create a new AxisSpec object, and assign it to the
Scale.var yspec = new AxisSpec(); yspec.setLineColor(java.awt.Color(0x0000ff)); yspec.setGridColor(java.awt.Color(0x0000ff)); yspec.setGridStyle(Chart.DOT_LINE); logscale.setAxisSpec(yspec); -
Create a new CategoricalScale for the X-axis, specifying ‘State’ as the field on which the scale is based.
var cscale = new CategoricalScale('State'); -
Remove the X-axis lines and tick marks. To do this, create a new
AxisSpecobject, and assign it to theScale.var xspec = new AxisSpec(); xspec.setLineVisible(false); xspec.setTickVisible(false); cscale.setAxisSpec(xspec); -
Move the X-axis labels above the chart area, and increase their size. To do this, create a new TextSpec object, and assign it to the
AxisSpec.var tspec = new TextSpec(); tspec.setFont(java.awt.Font('Dialog', java.awt.Font.BOLD, 14)); xspec.setTextSpec(tspec); xspec.setAxisStyle(AxisSpec.AXIS_SINGLE2); -
Create a new
TextFrame, and specify new axis labels to replace the default labels (‘NJ’, ‘NY’) with the full state names. Assign the newTextFrameto theAxisSpecobject.var tframe = new DefaultTextFrame(); tframe.setText('NJ','New Jersey'); tframe.setText('NY','New York'); xspec.setTextFrame(tframe); -
Assign the two
Scaleobjects to the appropriate axes of thegraphobject.graph.setScale('Quantity',logscale); graph.setScale('State',cscale);