GraphElement.setHint(type,value)
Add an effect to a GraphElement object. The corresponding “getter” function is getHint(type).
Parameter
- type
-
One of the following constants:
GraphElement.HINT_EXPLODED Element separation or explosion GraphElement.HINT_SHINE Three-dimensional shading GraphElement.HINT_ALPHA Transparency - value
-
-
For
HINT_EXPLODED:'true'or'false' -
For
HINT_SHINE:'true'or'false' -
For
HINT_ALPHA: float in range [0,1]
-
Examples
Chart Component Script
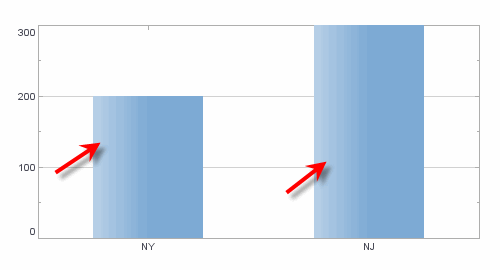
dataset = [["State", "Quantity"],["NY",200], ["NJ",300]]; (1)
graph = new EGraph();
var elem = new IntervalElement("State","Quantity"); (2)
elem.setHint(GraphElement.HINT_SHINE,'true'); (3)
graph.addElement(elem); (4)| 1 | See dataset to use a data block instead of an array literal. |
| 2 | Create the IntervalElement object. |
| 3 | Use setHint to apply shading. |
| 4 | Use addElement to add the IntervalElement to the Chart. |
Script that modifies the graph or dataset properties should be placed on the Chart component itself. See Add Component Script for more information. This script has access to the Chart data and Chart API methods. Scripted Charts are not good candidates for user-modification, so you should deselect ‘Enable Ad Hoc Editing’ in the Chart Properties dialog box.
|
|
To change the property on a Chart that was previously created with the Chart Editor, use “getter” methods such as EGraph.getElement(index) ① to obtain a handle to the desired GraphElement object. For example: |