FacetCoord.setOuterCoordinate(coord)
Specifies the rectangular coordinate set to use for the outer coordinates of the facet graph. The RectCoord object used for outer coordinates generally has categorical scales on both axes. The outerCoordinate can also be specified as an argument to the constructor. The corresponding “getter” function is getOuterCoordinate().
Parameter
- coord
-
A RectCoord object
Example
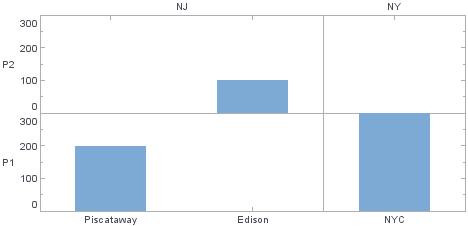
Chart Component Script
dataset = [["State", "City", "Product", "Quantity"],["NJ", "Piscataway", "P1", 200],
["NJ", "Edison", "P2", 100],["NY", "NYC", "P1", 300]]; (1)
graph = new EGraph();
var elem = new IntervalElement("City", "Quantity");
var state = new CategoricalScale("State");
var city = new CategoricalScale("City");
var product = new CategoricalScale("Product");
var quantity = new LinearScale("Quantity");
var inner = new RectCoord(city, quantity); (2)
var outer = new RectCoord(state, product); (2)
var coord = new FacetCoord(); (3)
coord.setInnerCoordinates([inner]);
coord.setOuterCoordinate(outer); (4)
graph.setCoordinate(coord); (5)
graph.addElement(elem);| 1 | See dataset to use a data block instead of an array literal. |
| 2 | Create the RectCoord objects. |
| 3 | Create a FacetCoord object. |
| 4 | Use setOuterCoordinate to assign the outer coordinates from the RectCoord to the FacetCoord. |
| 5 | Use EGraph.setCoordinate(coord) to add the Coordinate to the Chart. |
Script that modifies the graph or dataset properties should be placed on the Chart component itself. See Add Component Script for more information. This script has access to the Chart data and Chart API methods. Scripted Charts are not good candidates for user-modification, so you should deselect ‘Enable Ad Hoc Editing’ in the Chart Properties dialog box.
|