createBulletGraph(measure, ranges, target, color, xdims, ydims, opts)
The createBulletGraph() function generates a bullet graph to display a specified measure along with a target and multiple value ranges. (All parameters are optional. To omit any parameter setting, pass null as the value.)
Parameters
- measure
-
Name of column to provide the measure values
- ranges
-
Array of column names to provide range values, displayed as shaded regions
- target
-
Name of column to provide the target value, displayed as vertical bar
- color
-
Bullet color, either a scalar hex color value (e.g.,
0x0000FF), or an array of colors. The syntax for the color array is[measure, target, range 1, range 2, range 3, …], for example,[0x0000FF, 0xFF0000, 0xDD0000, 0xBB0000, 0x990000]. - xdims
-
Array of column names to use as dimensions on X-axis
- ydims
-
Array of column names to use as dimensions on Y-axis
- opts
-
String containing additional options:
'vertical=false': force horizontal bars
'ylabel=false': hide y-dimension labels
'xlabel=false': hide x-dimension labels
'vlabel=false': hide the measure value labels
Example
Consider the Data Worksheet data block ‘Query1’ shown below. (This data block is a mirror of the ‘All Sales’ data block, with expression columns for ‘Target’, ‘range1’, ‘range2’, and ‘range3’, grouping on the ‘Employee’ and ‘Company’ fields, ‘Sum’ aggregation on the ‘Total’ field, and ‘Max’ aggregation on the expression columns.)
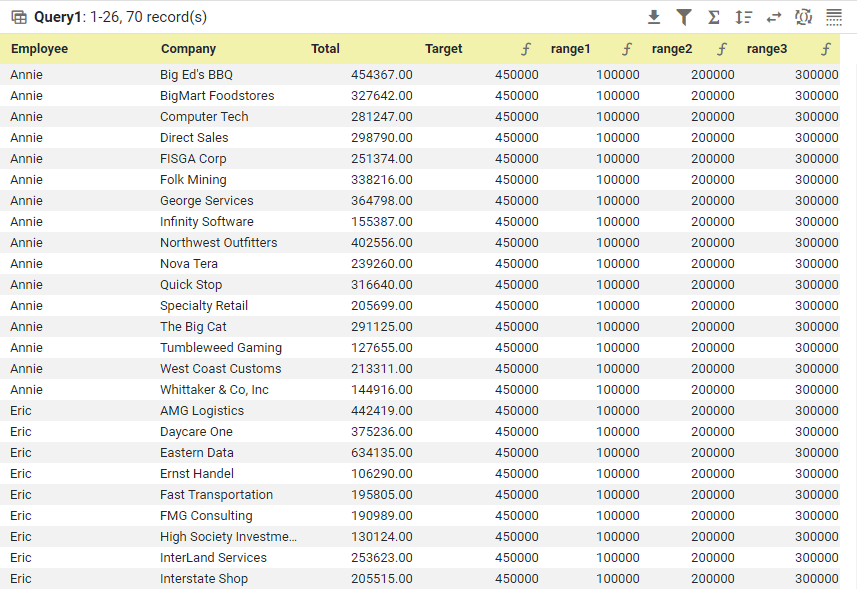
| The ‘All Sales’ Data Worksheet can be found in the folder. You may need to download the examples.zip file from GitHub into your environment. (This requires access to Enterprise Manager.) See Import and Export Assets for instructions on how to import. |
-
Create a Dashboard based on this Data Worksheet. (See Create a New Dashboard.)
-
Add a Chart component.
-
Add the following script in the Chart Properties Script tab.
Chart Component Scriptdataset = viewsheet['Query1']; (1) graph = createBulletGraph('Total', ['range1','range2','range3'],'Target',0x0000FF, \ ['Company'],['Employee'],'vertical=false'); (2)1 See dataset for more information about setting the dataset.2 Create the bullet chart. 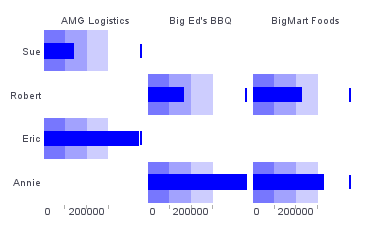
Script that modifies the graph or dataset properties should be placed on the Chart component itself. See Add Component Script for more information. This script has access to the Chart data and Chart API methods. Scripted Charts are not good candidates for user-modification, so you should deselect ‘Enable Ad Hoc Editing’ in the Chart Properties dialog box.
|