axis.lineColor
Type
number (hex)          Example: 0xFF0000
string (color name)   Example: 'red'
array [r,g,b]         Example: [255,0,0]
JSON {r:_,g:_,b:_}    Example: {r:255,g:0,b:0}
java.awt.Color        Example: java.awt.Color.BLUE (BLACK, CYAN, DARK_GRAY,
                               GRAY, GREEN, LIGHT_GRAY, MAGENTA, ORANGE,
                               PINK, RED, WHITE, YELLOW)
Example
Chart1.axis['Company'].lineColor = [255,0,0];
Chart1.axis['Company'].lineColor = {r:255,g:0,b:0}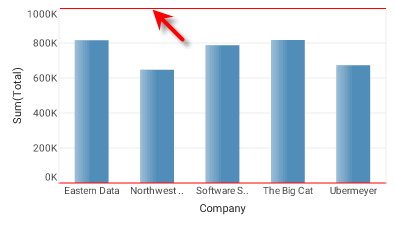
|
Either syntax below can be used in component script: For onInit/onRefresh scripts, and for component and property scripts on other components, the second (qualified) form is required. |