Change Chart Labels
When you assign a TextFrame to a Chart element to represent data textually, you can modify the labels by using TextFrame.setText(value,text).
Walkthrough
The following example illustrates how you can construct custom labels for the chart using script. The labels display the names of the companies represented on the chart together with each company’s percentage of total sales.
-
Create a Dashboard with a Chart based on the ‘All Sales’ Data Worksheet. (See Create a New Dashboard.)
The ‘All Sales’ Data Worksheet can be found in the folder. You may need to download the examples.zip file from GitHub into your environment. (This requires access to Enterprise Manager.) See Import and Export Assets for instructions on how to import. -
Place the ‘Company’ field in the ‘X’ region and the ‘Total’ field in the ‘Y’ region.
-
Press the ‘Edit Dimension’ button
 next to the ‘Company’ field. From the ‘Ranking’ menu, select “Top 5 of Sum(Total)” and press the ‘Apply’ button
  .
. -
Right-click the Chart and select ‘Properties’. Enter the script below into the Script tab.
// Create new TextFrame based on 'Company' field:
var tframe = new DefaultTextFrame('Company');

// Get a handle to the graph element (bars):
var elem = graph.getElement(0);

// Assign the TextFrame to the element. This adds the
// category names above the bars (text-coding).
elem.setTextFrame(tframe)

// Compute the total amount of all companies:
var sumTotal = sum(data['Sum(Total)']);

// Loop through companies on chart:
for(i=1; i<data.length; i++) {

  // Get the original label (company):
  var oldLabel = data[i][0];

  // Compute the fractional value of corresponding 'Total':
  var barFraction = data[i][1]/sumTotal;

  // Format the fraction as a percent:
  var barPercent = formatNumber(barFraction,'##.00%');

  // Compose the new label, with form 'Company:Percent':
  var newLabel = oldLabel + ':\n' + barPercent;

  // Assign the new label in place of the old label:
  tframe.setText(oldLabel,newLabel);
}
Script that modifies the graph or dataset properties should be placed on the Chart component itself. See Add Component Script for more information. This script has access to the Chart data and Chart API methods. Scripted Charts are not good candidates for user-modification, so you should deselect ‘Enable Ad Hoc Editing’ in the Chart Properties dialog box.
|
+
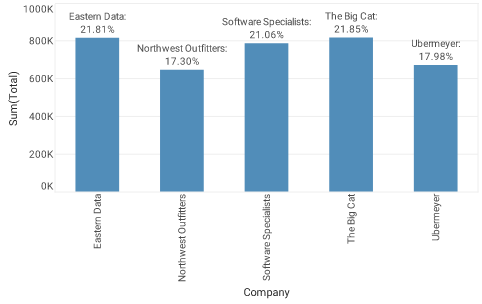
The above script uses a customized TextFrame to display the company name together with the percentage of total represented by each company. The TextFrame.setText(value,text) function is the key to replacing one set of labels by a different set of labels.
In the above example you created a completely new TextFrame to display the data, but you can use the same technique to modify an existing TextFrame. For example, to modify the existing X-axis labels, you would first get a handle to the existing X-axis TextFrame. For example:
var tframe = graph.getCoordinate().getXScale().getAxisSpec().getTextFrame();Because this TextFrame is already associated with the X-axis labels, there is no need to assign the TextFrame to the axis. The only thing you need to do is to swap in the new labels. Here is the revised script in its entirety:
// Get a handle to the existing X-axis TextFrame:
var tframe = graph.getCoordinate().getXScale().getAxisSpec().getTextFrame();

// Get a handle to the graph element (bars):
var elem = graph.getElement(0);

// Compute the total amount of all companies:
var sumTotal = sum(data['Sum(Total)']);

// Loop through companies on chart:
for(i=1; i<data.length; i++) {

  // Get the original label (company):
  var oldLabel = data[i][0];

  // Compute the fractional value of corresponding 'Total':
  var barFraction = data[i][1]/sumTotal;

  // Format the fraction as a percent:
  var barPercent = formatNumber(barFraction,'##.00%');

  // Compose the new label, with form 'Company:Percent':
  var newLabel = oldLabel + ':\n' + barPercent;

  // Assign the new label in place of the old label:
   tframe.setText(oldLabel,newLabel);
}