LinearScale.setScaleRange(range)
Specifies the calculation strategy for finding the scale range. The corresponding “getter” function is getScaleRange().
Parameter
- range
-
a ScaleRange object
Example
Chart Component Script
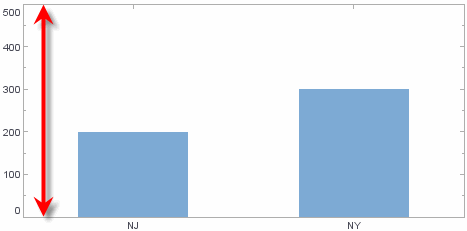
dataset = [["State", "Quantity"], ["NJ",200], ["NY",300]]; (1)
graph = new EGraph();
var qscale = new LinearScale("Quantity"); (2)
var elem = new IntervalElement("State", "Quantity");
qscale.setScaleRange(new StackRange()); // adds 200+300 (3)
graph.setScale("Quantity", qscale); (4)
graph.addElement(elem);| 1 | See dataset to use a data block instead of an array literal. |
| 2 | Create the LinearScale object. |
| 3 | Use setScaleRange to compute the scale range by stacking. |
| 4 | Use EGraph.setScale(field, scale) to assign the Scale to the Chart. |
Script that modifies the graph or dataset properties should be placed on the Chart component itself. See Add Component Script for more information. This script has access to the Chart data and Chart API methods. Scripted Charts are not good candidates for user-modification, so you should deselect ‘Enable Ad Hoc Editing’ in the Chart Properties dialog box.
|