PolarCoord.setHoleRatio(value)
|
Specifies the size of the “hole” when using the PolarCoord.PLUS option for PolarCoord.setType(value). The corresponding “getter” function is getHoleRatio().
Parameter
- value
-
Number between 0 and 1, indicating the fraction of outer plot radius occupied by center hole. Default is 0.5, specifying hole radius as half of outer plot radius. Value of 0 specifies no hole; value of 1 sets hole to full chart.
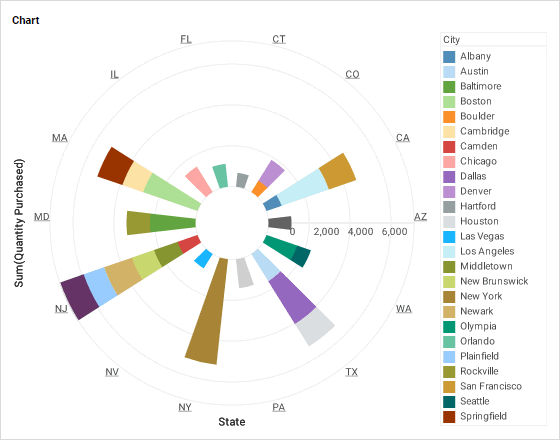
Example
-
Create a Dashboard based on the ‘Sales Explore’ Data Worksheet. (See Create a New Dashboard.)
The 'Sales Explore' Data Worksheet can be found in . You may need to download the examples.zip file from GitHub into your environment. (This requires access to Enterprise Manager.) See Import and Export Assets for instructions on how to import. -
Press the ‘Select Chart Style’ button
 and select ‘Bar Chart’ with the ‘Stack’ option enabled.
 -
Set ‘State’ on the X-axis, ‘Sum(Quantity Purchased)’ on the Y-axis, and ‘City’ in the ‘Color’ binding.
-
Press the ‘Finish’ button
 to close the Editor.
 -
Add the script below.
var coord = graph.getCoordinate(); (1)
var polar = new PolarCoord(coord); (2)
polar.setType(PolarCoord.PLUS);
polar.setHoleRatio(.25); (3)
graph.setCoordinate(polar); (4)| 1 | Get a handle to the Coordinate object. |
| 2 | Create the PolarCoord object. |
| 3 | Use setHoleRatio to set the hole to ¼ of the outer plot radius. |
| 4 | Use EGraph.setCoordinate(coord) to add the Coordinate to the Chart. |
Script that modifies the graph or dataset properties should be placed on the Chart component itself. See Add Component Script for more information. This script has access to the Chart data and Chart API methods. Scripted Charts are not good candidates for user-modification, so you should deselect ‘Enable Ad Hoc Editing’ in the Chart Properties dialog box.
|