Coordinate.transpose()
Interchanges the axes. For example, in a rectangular coordinate system, the X-axis becomes the Y-axis, and the Y-axis becomes the X-axis.
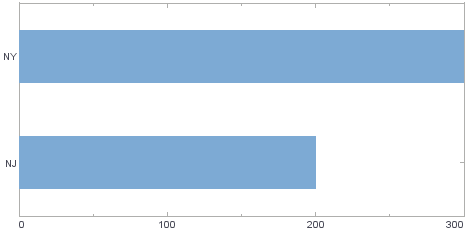
Example
Chart Component Script
dataset = [["State", "Quantity"], ["NJ", 200], ["NY", 300]]; (1)
graph = new EGraph();
var elem = new IntervalElement("State", "Quantity");
var sscale = new CategoricalScale("State");
var qscale = new LinearScale("Quantity");
var coord = new RectCoord(sscale,qscale); (2)
coord.transpose(); (3)
graph.setCoordinate(coord); (4)
graph.addElement(elem);| 1 | See dataset to use a data block instead of an array literal. |
| 2 | Create the Coordinate object. |
| 3 | Use transpose to transpose the axes. |
| 4 | Use EGraph.setCoordinate(coord) to add the Coordinate to the Chart. |
Script that modifies the graph or dataset properties should be placed on the Chart component itself. See Add Component Script for more information. This script has access to the Chart data and Chart API methods. Scripted Charts are not good candidates for user-modification, so you should deselect ‘Enable Ad Hoc Editing’ in the Chart Properties dialog box.
|
|
To change the property on a Chart that was previously created with the Chart Editor, use EGraph.getCoordinate() ① to obtain a handle to the desired Coordinate object. For example: |