MultiShapeFrame.setScales(arr)
Specifies the scales to be used for each shape field. The corresponding “getter” function is getScales().
Parameter
- arr
-
Array of Scale
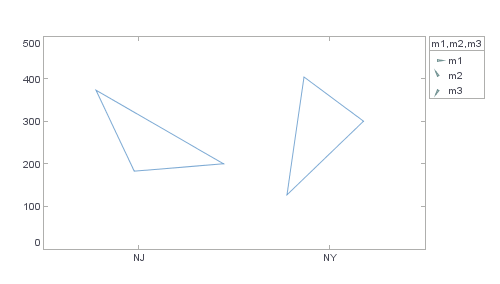
Example
Chart Component Script
dataset = [["State", "Quantity", "m1", "m2", "m3"], ["NJ", 200, 50,50,5], ["NY", 300,20,30,50]]; (1)
graph = new EGraph();
var frame = new StarShapeFrame(); (2)
var elem = new PointElement("State", "Quantity");
var yscale = new LinearScale("Quantity");
yscale.setMax(500);
frame.setFields(["m1", "m2", "m3"]); (3)
var scale1 = new LinearScale("m1");
var scale2 = new LinearScale("m2");
var scale3 = new LinearScale("m3");
scale1.setMax(10);
scale2.setMax(10);
scale3.setMax(10);
frame.setScales([scale1, scale2, scale3]); (4)
elem.setShapeFrame(frame); (5)
graph.setScale("Quantity",yscale);
graph.addElement(elem);| 1 | See dataset to use a data block instead of an array literal. |
| 2 | Create the MultiShapeFrame object. |
| 3 | Use setFields to specify the fields for the MultiShapeFrame. |
| 4 | Use setScales to specify the scales for the MultiShapeFrame. |
| 5 | Use GraphElement.setShapeFrame(frame) to add the MultiShapeFrame to the PointElement. |
Script that modifies the graph or dataset properties should be placed on the Chart component itself. See Add Component Script for more information. This script has access to the Chart data and Chart API methods. Scripted Charts are not good candidates for user-modification, so you should deselect ‘Enable Ad Hoc Editing’ in the Chart Properties dialog box.
|