Change Legend Properties
|
When you assign a VisualFrame to a Chart element to visually code data, a corresponding legend is created automatically. You can change the appearance of this legend by editing the VisualFrame’s LegendSpec.
Consider the following Chart component script:
dataset = [["State", "Quantity"], ["NJ",200], ["NY",300]];
graph = new EGraph();
var elem = new IntervalElement("State", "Quantity");
var frame = new CategoricalColorFrame("State");
elem.setColorFrame(frame);
graph.addElement(elem);
Script that modifies the graph or dataset properties should be placed on the Chart component itself. See Add Component Script for more information. This script has access to the Chart data and Chart API methods. Scripted Charts are not good candidates for user-modification, so you should deselect ‘Enable Ad Hoc Editing’ in the Chart Properties dialog box.
|
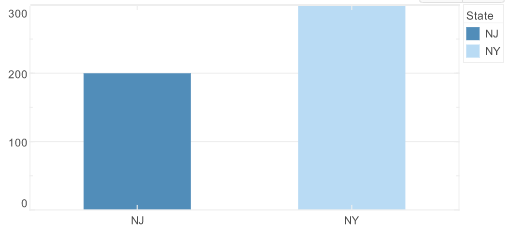
This creates a basic bar chart displaying the dimensions ‘State’ and ‘Quantity’. In this script, a CategoricalColorFrame distinguishes the different states by color. Follow the steps below to experiment with modifying the chart’s legend:
-
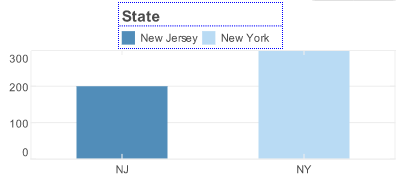
Change the legend border to a blue dotted line. To do this, create a LegendSpec object and assign it to the ColorFrame.
var legend = new LegendSpec(); legend.setBorder(Chart.DOT_LINE); legend.setBorderColor(java.awt.Color(0x0000ff)); frame.setLegendSpec(legend); -
Change the legend title to say simply ‘State’, and make the text bold. To do this, create a TextSpec object and assign it to the
LegendSpec.var tspec = new TextSpec(); tspec.setFont(java.awt.Font('Dialog',java.awt.Font.BOLD, 14)); legend.setTitleTextSpec(tspec); legend.setTitle('State'); -
Change the text inside the legend to display the full state names. To do this, create a TextFrame object and assign it to the
LegendSpec.var tframe = new DefaultTextFrame(); tframe.setText('NJ','New Jersey'); tframe.setText('NY','New York'); legend.setTextFrame(tframe); -
Place the legend above the chart. Use the EGraph.setLegendLayout(value) property to do this.
graph.setLegendLayout(Chart.TOP);