setupGoogleMapsPlot(graph, urlPrefix, data, latitudeColumnName, longitudeColumnName, maxWidthPx, maxHeightPx, widthPx, heightPx)
| In order to use this function, you must first obtain a Google Maps API key. See the Maps JavaScript API documentation for more information. |
Creates a Chart background based on a requested Google Map. Note that the maxWidthPx and maxHeightPx control the zoom of the map. Smaller values of maxWidthPx and maxHeightPx compress the data points into a smaller image region, resulting in a zoomed-out view. Larger values of maxWidthPx and maxHeightPx display the data points within a larger image region, resulting in a zoomed-in or enlarged view.
| You can also configure web map backgrounds without scripting. See Web Map for more information. |
Parameter
- graph
-
A graph object
- urlPrefix
-
The Google maps URL prefix
- data
-
The data array
- latitudeColumnName
-
The latitude column name in the data array
- longitudeColumnName
-
The longitude column name in the data array
- maxWidthPx
-
The maximum width in pixels within which the data points should all be contained
- maxHeightPx
-
The maximum height in pixels within which the data points should all be contained
- widthPx
-
The actual width of the map image in pixels
- heightPx
-
The actual height of the map image in pixels
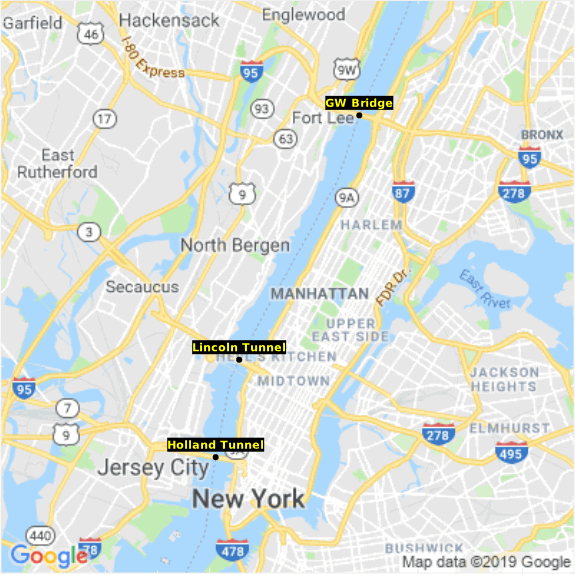
Example
The example below uses Chart API scripting. See Chart Script Tutorial for more details about API script.
Script that modifies the graph or dataset properties should be placed on the Chart component itself. See Add Component Script for more information. This script has access to the Chart data and Chart API methods. Scripted Charts are not good candidates for user-modification, so you should deselect ‘Enable Ad Hoc Editing’ in the Chart Properties dialog box.
|
dataset = [["Latitude","Longitude","PlaceName"],[40.8516051126306,-73.95223617553711,'GW Bridge'],[40.76292614285948,-74.00982856750488,'Lincoln Tunnel'],[40.72755146730012,-74.02107238769531,'Holland Tunnel']];
ar latName = "Latitude";
var lngName = "Longitude";
var maxWidthPx = 300;
var maxHeightPx = 300;
var widthPx = 400;
var heightPx = 400;
graph = new EGraph();
var urlPrefix = "https://maps.googleapis.com/maps/api/staticmap?&key=<your API key>";
setupGoogleMapsPlot(graph, urlPrefix, dataset, latName, lngName, maxWidthPx, maxHeightPx, widthPx, heightPx);
// Define chart elements and basic point appearance:
var elem = new PointElement(lngName, latName);
var tframe = new DefaultTextFrame("PlaceName");
var sframe = new StaticShapeFrame();
var cframe = new StaticColorFrame();
cframe.setColor(java.awt.Color(0x0000000));
sframe.setShape(GShape.FILLED_CIRCLE);
// Define appearance of text labels:
var tspec = new TextSpec();
tspec.setBackground(java.awt.Color(0x0000000));
tspec.setFont(java.awt.Font('Trebuchet',java.awt.Font.BOLD, 11));
tspec.setColor(java.awt.Color(0xffff00));
// Assign visual frames to chart elements:
elem.setTextFrame(tframe);
elem.setTextSpec(tspec);
elem.setShapeFrame(sframe);
elem.setColorFrame(cframe);
elem.setHint(GraphElement.HINT_ALPHA,1);
graph.addElement(elem);