Filter Aggregated Data
|
Filter Data, in Prepare Your Data, to filter aggregated data in a Data Worksheet. |
Filter components such as Selection Lists (see Add Filter Components) and filter Conditions (see Add Conditions) generally apply to data before it has been grouped and aggregated in a Chart or Crosstab. To filter data after it has been grouped and aggregated, use a Range Slider or use an ad hoc filter, as described below.
Filter Aggregated Data with Range Slider
You can use a Range Slider to filter the post-aggregate data displayed by a Chart, Crosstab, or Freehand Table. To do this, follow the steps below:
-
Drag a ‘Range Slider’ element from the Toolbox into the Dashboard.
-
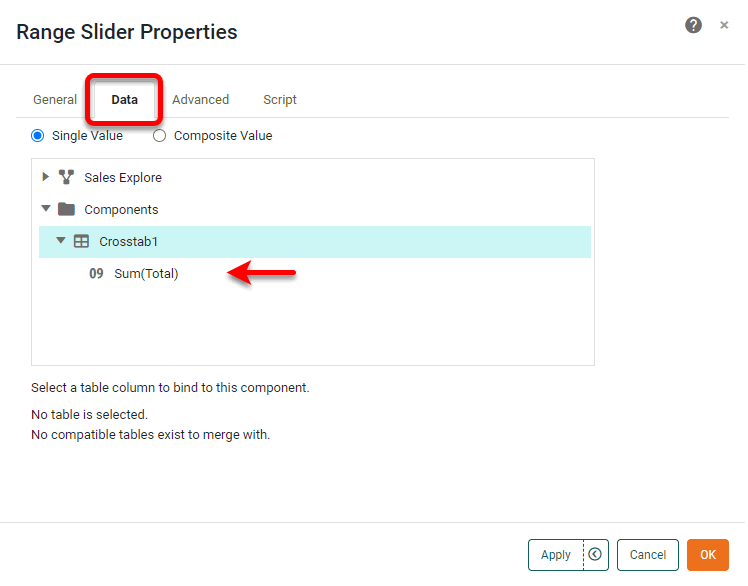
Right-click on the Range Slider and select ‘Properties’ from the context menu. This opens the ‘Range Slider Properties’ panel.
-
Select the Data tab. In the ‘Table’ panel, expand the ‘Assemblies’ node, and select the component and aggregated field that you want to filter.
-
Press OK to close the panel.
This Range Slider will now filter the post-aggregate values in the selected Chart, Crosstab, or Freehand Table.
Filter Aggregated Data with Ad Hoc Filter
Watch Video: Filtering a Dashboard (Post-Aggregate Filter)
This video might show an earlier version of the feature or operation that differs in minor ways from the current version.
The easiest way to filter a Table or Chart is by using Filter components. (See Filter a Dashboard for more information.) However, if the Dashboard includes a Selection Container, you can also filter by using the right-click ‘Filter’ option. To do this, see the sections below:
Ad Hoc Filter Post-Aggregate Tabular Data
To filter aggregated data in a Crosstab or Freehand Table, follow the steps below:
-
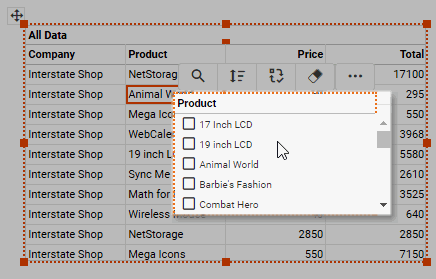
Right-click on the column that you want to filter and select ‘Filter’ from the context menu. Note: You can also access menu options from the ‘More’ button (
 ) in the mini-toolbar.
The ‘Filter’ option is only available if the Dashboard contains a Selection Container component. 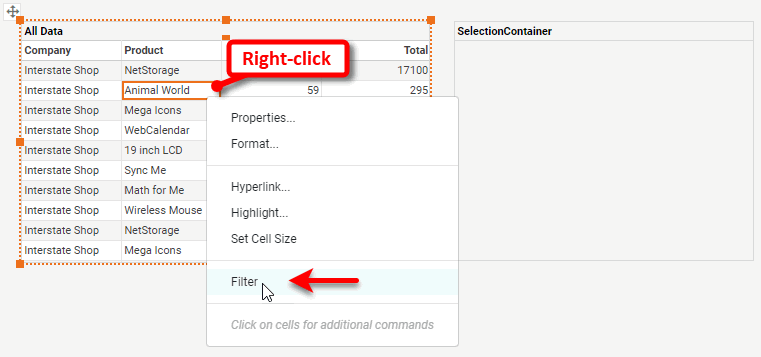
This opens a Filter control for the column: Selection List for a string-type column, Range Slider for a numerical-type or date-type column.
-
Make the desired selection using the Filter control, and click away from the column to submit. (See Use Filter Components for information on how to use these controls.) The selections that you make are shown in the Selection Container.
For a Crosstab or Freehand Table with aggregation, a Range Slider filters the post-aggregate data. 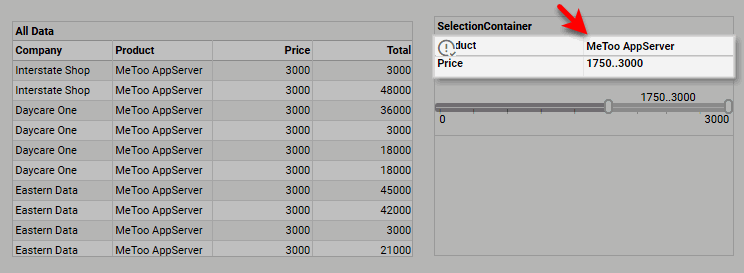
-
To remove the filter from a particular column, follow the steps above, and press the ‘Unselect’ button
 on the Filter control.
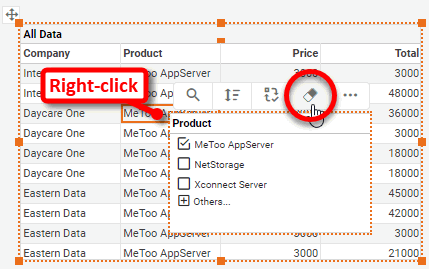
-
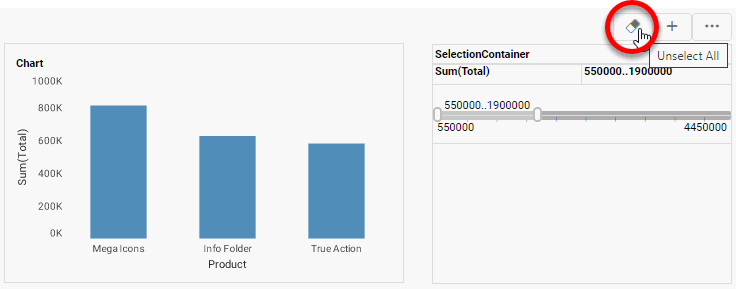
To remove all filters on the table, press the ‘Unselect All’ button
in the Selection Container.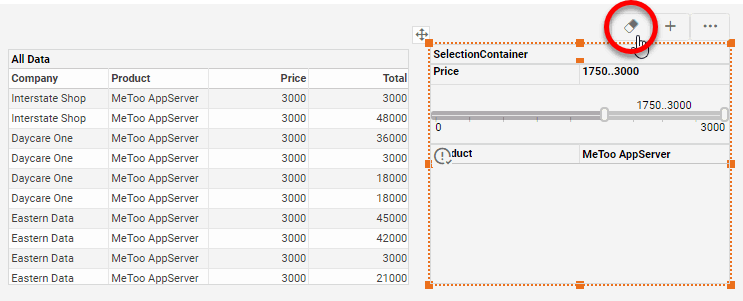
Ad Hoc Filter Post-Aggregate Chart Data
To filter aggregated Chart data, follow the steps below:
-
Right-click on the dimension label or measure that you want to filter and select ‘Filter’ from the context menu. Note: You can also access menu options from the ‘More’ button (
) in the mini-toolbar.The ‘Filter’ option is only available if the Dashboard contains a Selection Container component. 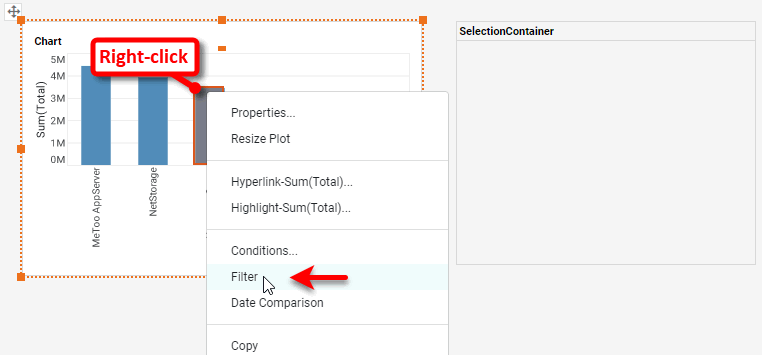
What is a measure? What is a dimension?
A measure is generally used for aggregation, for example summation, averaging, correlation, etc., within a Crosstab, Chart, Text component, or Gauge. Adding a measure to the ‘Y’ region in a chart displays the computed aggregates by using locations on the Y-axis. Adding a measure to the ‘X’ region displays the computed aggregates by using locations on the X-axis. You can also display aggregates by using color, shape, size, or label.
A dimension is used to break-down the dataset into multiple groups, often within a Crosstab, Chart, or Selection List. Adding a dimension to the ‘X’ region of a Chart distinguishes the different dimension groups by location on the X-axis. Adding a dimension to the ‘Y’ region distinguishes the different dimension groups by location on the Y-axis. You can add multiple dimensions into the ‘X’ or ‘Y’ regions of a Chart, or into the ‘Rows’ or ‘Columns’ regions of a Crosstab, to create multiple grouping levels. You can also distinguish groups in a dimension by using color, shape, size, or label in a Chart.
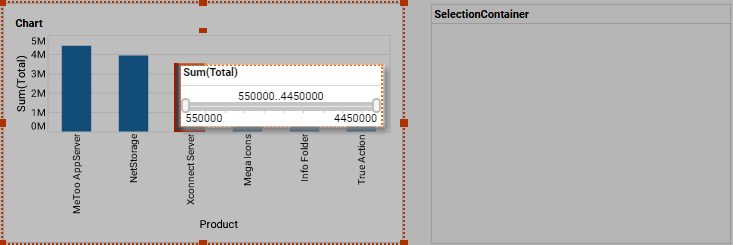
This opens the Filter control for the selected dimension or measure: Selection List for a string-type field, Range Slider for a numerical-type or date-type field.
-
Make the desired selection using the Filter control, and click away to submit. (See Use Filter Components for information on how to use these controls.) The selections that you make are shown in the Selection Container.
A Range Slider filters the post-aggregate data. 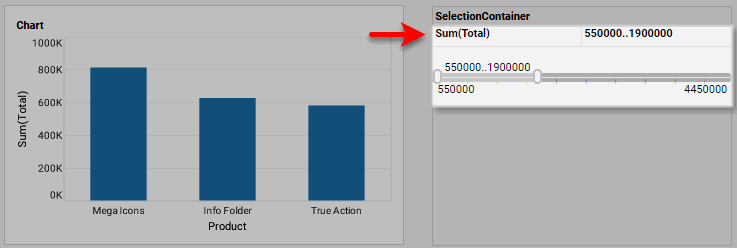
-
To remove the filter from a particular field, follow the steps above, and press the ‘Unselect’ button
on the Filter control.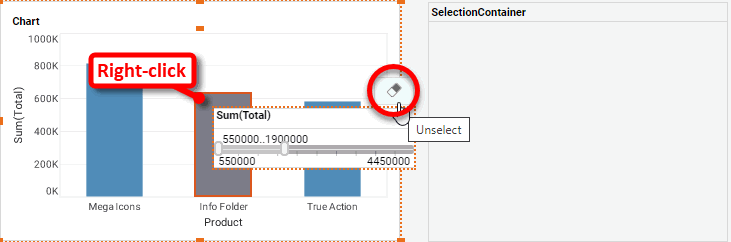
-
To remove all filters on the chart, press the ‘Unselect All’ button
.