PointElement
The PointElement object contains the visual elements for a point (scatter) chart. To create a new PointElement object, call the PointElement constructor.
var elem = new PointElement("State", "Quantity");You can pass a set of field names (e.g., ‘State’, ‘Quantity’) to the constructor, or specify these later using the GraphElement.addDim(field) and GraphElement.addVar(field) methods.
Example
Chart Component Script
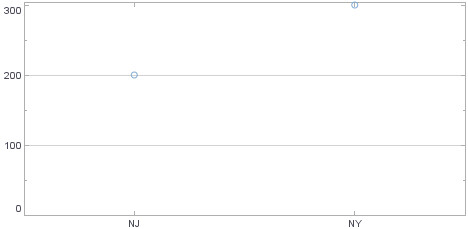
dataset = [["State", "Quantity"], ["NJ", 200], ["NY", 300]]; (1)
graph = new EGraph();
var elem = new PointElement("State", "Quantity"); (2)
graph.addElement(elem); (3)| 1 | See dataset to use a data block instead of an array literal. |
| 2 | Create the PointElement object. |
| 3 | Use EGraph.addElement(elem) to add the PointElement to the Chart. |
Script that modifies the graph or dataset properties should be placed on the Chart component itself. See Add Component Script for more information. This script has access to the Chart data and Chart API methods. Scripted Charts are not good candidates for user-modification, so you should deselect ‘Enable Ad Hoc Editing’ in the Chart Properties dialog box.
|