GradientColorFrame.setToColor(value)
Specifies the ending color (for highest value) of the gradient. The corresponding “getter” function is getToColor().You can also set this using the bindingInfo.colorFrame.toColor property syntax in onRefresh script. See Example 2 below.
Paramater (Function Syntax)
- value
-
a java.awt.Color object
Value (Property Syntax)
number (hex)          Example: 0xFF0000
string (color name)   Example: 'red'
array [r,g,b]         Example: [255,0,0]
JSON {r:_,g:_,b:_}    Example: {r:255,g:0,b:0}
java.awt.Color        Example: java.awt.Color.BLUE (BLACK, CYAN, DARK_GRAY,
                               GRAY, GREEN, LIGHT_GRAY, MAGENTA, ORANGE,
                               PINK, RED, WHITE, YELLOW)
Example 1
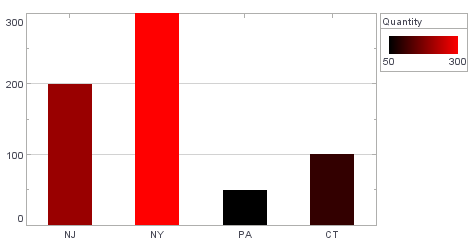
dataset = [["State", "Quantity"],["NJ",200],["NY",300],["PA",50],["CT",100]]; (1)
graph = new EGraph();
var elem = new IntervalElement("State", "Quantity");
var frame = new GradientColorFrame(); (2)
frame.setFromColor(java.awt.Color(0x000000));
frame.setToColor(java.awt.Color(0xff0000)); (3)
frame.setField("Quantity"); (4)
elem.setColorFrame(frame); (5)
graph.addElement(elem);| 1 | See dataset to use a data block instead of an array literal. |
| 2 | Create the GradientColorFrame object. |
| 3 | Use setToColor to specify the end color for the GradientColorFrame. |
| 4 | Use setField to specify the field for the GradientColorFrame. |
| 5 | Use GraphElement.setColorFrame(frame) to add the ColorFrame to the Chart. |
Script that modifies the graph or dataset properties should be placed on the Chart component itself. See Add Component Script for more information. This script has access to the Chart data and Chart API methods. Scripted Charts are not good candidates for user-modification, so you should deselect ‘Enable Ad Hoc Editing’ in the Chart Properties dialog box.
|
|
To change the property on a Chart that was previously created with the Chart Editor, use “getter” methods such as EGraph.getElement(index) ① to obtain a handle to the desired GraphElement object. For example: |
Example 2
This example illustrates how to use bindingInfo properties to control the ColorFrame.
-
Bind a Bar Chart to the sample ‘All Sales’ Data Worksheet, with ‘Company’ (top 5) on the X-axis, and Sum(Total) on the Y-axis.
The ‘All Sales’ Data Worksheet can be found in the folder. You may need to download the examples.zip file from GitHub into your environment. (This requires access to Enterprise Manager.) See Import and Export Assets for instructions on how to import. -
Add the following script in the onRefresh handler. (See Add Dashboard Script.)
onRefresh ScriptChart1.bindingInfo.setColorField("Total",Chart.NUMBER); Chart1.bindingInfo.colorFrame = new GradientColorFrame; Chart1.bindingInfo.colorFrame.fromColor = 0x0000FF; Chart1.bindingInfo.colorFrame.toColor = 0xFF00FF;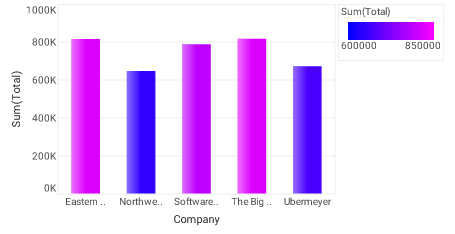
Dashboard script that modifies bindingInfoshould generally be placed in the onRefresh handler. See Add Dashboard Script.