CategoricalScale
The CategoricalScale object contains a nominal scale, i.e., a scale that logically maps nominal values to physical attributes. To create a CategoricalScale object, call the CategoricalScale constructor with the fields for which the scale should be generated.
var qscale = new CategoricalScale('State');You can pass the names of the fields (e.g., ‘State’) for which the scale should be generated to the constructor, or specify these later using the inherited Scale.setFields(field) method.
The following special methods are provided:
Example
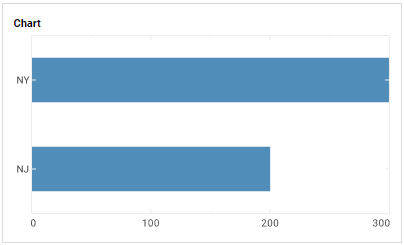
Chart Component Script
dataset = [["State","Quantity"], ["NJ",200], ["NY",300]]; (1)
graph = new EGraph();
var elem = new IntervalElement("State", "Quantity");
var sscale = new CategoricalScale("State"); (2)
var qscale = new LinearScale("Quantity");
var coord = new RectCoord(sscale, qscale); (3)
coord.transpose();
graph.setCoordinate(coord);
graph.addElement(elem);| 1 | See dataset to use a data block instead of an array literal. |
| 2 | Create the CategoricalScale object. |
| 3 | Assign the scale to a Coordinate object. |
Script that modifies the graph or dataset properties should be placed on the Chart component itself. See Add Component Script for more information. This script has access to the Chart data and Chart API methods. Scripted Charts are not good candidates for user-modification, so you should deselect ‘Enable Ad Hoc Editing’ in the Chart Properties dialog box.
|